
- Excel - Home
- Excel - Getting Started
- Excel - Explore Window
- Excel - Backstage
- Excel - Entering Values
- Excel - Move Around
- Excel - Save Workbook
- Excel - Create Worksheet
- Excel - Copy Worksheet
- Excel - Hiding Worksheet
- Excel - Delete Worksheet
- Excel - Close Workbook
- Excel - Open Workbook
- Excel - Merge Workbooks
- Excel - File Password
- Excel - File Share
- Excel - Emoji & Symbols
- Excel - Context Help
- Excel - Insert Data
- Excel - Select Data
- Excel - Delete Data
- Excel - Move Data
- Excel - Rows & Columns
- Excel - Copy & Paste
- Excel - Find & Replace
- Excel - Spell Check
- Excel - Zoom In-Out
- Excel - Special Symbols
- Excel - Insert Comments
- Excel - Add Text Box
- Excel - Shapes
- Excel - 3D Models
- Excel - CheckBox
- Excel - Add Sketch
- Excel - Scan Documents
- Excel - Auto Fill
- Excel - SmartArt
- Excel - Insert WordArt
- Excel - Undo Changes
- Formatting Cells
- Excel - Setting Cell Type
- Excel - Move or Copy Cells
- Excel - Add Cells
- Excel - Delete Cells
- Excel - Setting Fonts
- Excel - Text Decoration
- Excel - Rotate Cells
- Excel - Setting Colors
- Excel - Text Alignments
- Excel - Merge & Wrap
- Excel - Borders and Shades
- Excel - Apply Formatting
- Formatting Worksheets
- Excel - Sheet Options
- Excel - Adjust Margins
- Excel - Page Orientation
- Excel - Header and Footer
- Excel - Insert Page Breaks
- Excel - Set Background
- Excel - Freeze Panes
- Excel - Conditional Format
- Excel - Highlight Cell Rules
- Excel - Top/Bottom Rules
- Excel - Data Bars
- Excel - Color Scales
- Excel - Icon Sets
- Excel - Clear Rules
- Excel - Manage Rules
- Working with Formula
- Excel - Formulas
- Excel - Creating Formulas
- Excel - Copying Formulas
- Excel - Formula Reference
- Excel - Relative References
- Excel - Absolute References
- Excel - Arithmetic Operators
- Excel - Parentheses
- Excel - Using Functions
- Excel - Builtin Functions
- Excel Formatting
- Excel - Formatting
- Excel - Format Painter
- Excel - Format Fonts
- Excel - Format Borders
- Excel - Format Numbers
- Excel - Format Grids
- Excel - Format Settings
- Advanced Operations
- Excel - Data Filtering
- Excel - Data Sorting
- Excel - Using Ranges
- Excel - Data Validation
- Excel - Using Styles
- Excel - Using Themes
- Excel - Using Templates
- Excel - Using Macros
- Excel - Adding Graphics
- Excel - Cross Referencing
- Excel - Printing Worksheets
- Excel - Email Workbooks
- Excel- Translate Worksheet
- Excel - Workbook Security
- Excel - Data Tables
- Excel - Pivot Tables
- Excel - Simple Charts
- Excel - Pivot Charts
- Excel - Sparklines
- Excel - Ads-ins
- Excel - Protection and Security
- Excel - Formula Auditing
- Excel - Remove Duplicates
- Excel - Services
- Excel Useful Resources
- Excel - Keyboard Shortcuts
- Excel - Quick Guide
- Excel - Functions
- Excel - Useful Resources
- Excel - Discussion
Excel - SmartArt
What is SmartArt in Excel?
Smart graphics range from graphical lists and process diagrams to more complicated graphics like Architecture Layout, Basic Chevron process, Cycle Matrix, Segmented Pyramid, etc. The SmartArt feature in Microsoft Excel quickly develops business processes and Venn diagrams according to the business requirements.
Categories of SmartArt
Various categories of the SmartArt are given below −
- All
- List
- Process
- Hierarchy
- Relation
- Matrix
- Pyramid
- Picture
SmartArt Graphic in Excel
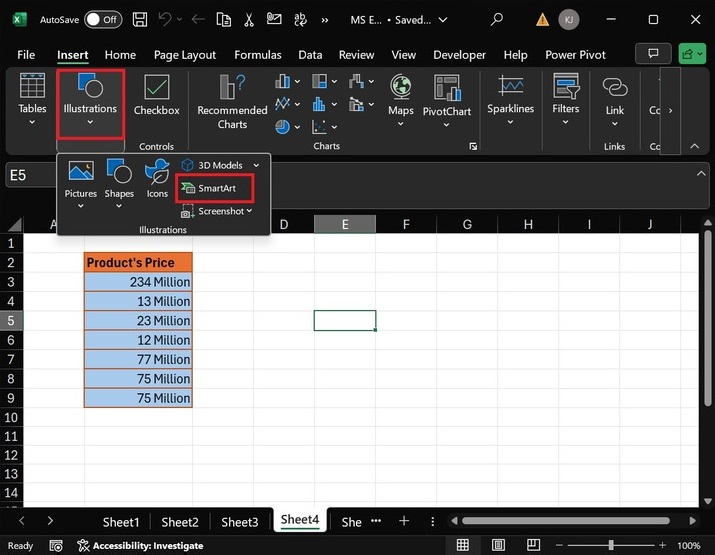
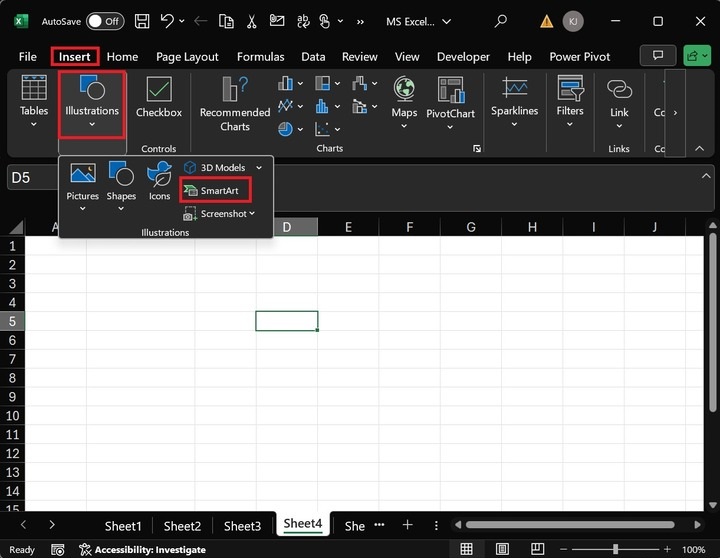
You may switch to the Insert tab, expand the Illustrations tile, and select the SmartArt option from the drop-down menu under the Illustrations group.
SmartArt Hierarchy in Excel
Below are the steps to add the Smart Art graphics in the Microsoft Excel −
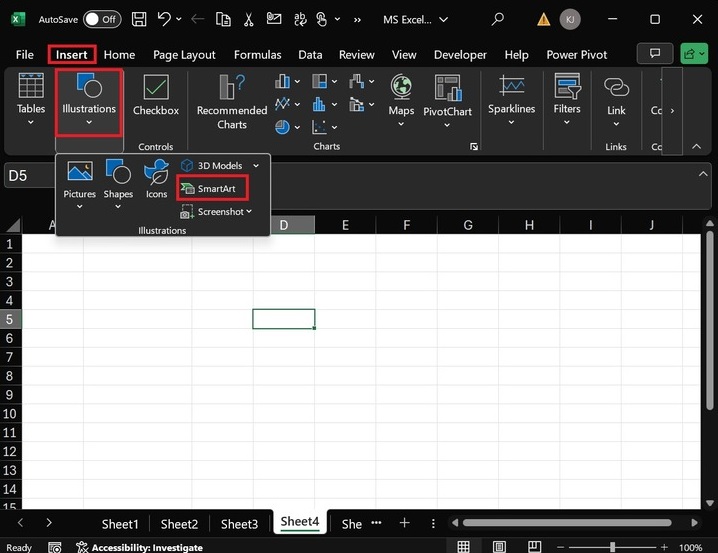
Step 1 − First, create a new worksheet where you wish to insert the SmartArt hierarchy in Microsoft Excel. Then, navigate to the "Insert" tab and select the "SmartArt" options from the Illustrations group.
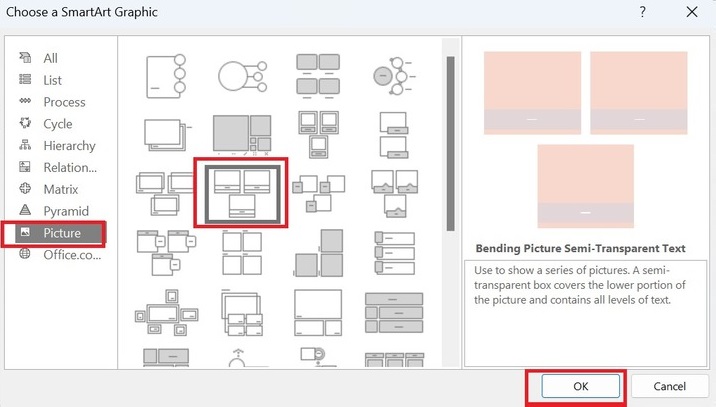
Step 2 − After that, another dialog box, "Choose a SmartArt graphic," will open. Select the "Hierarchy" category from the list and choose the Hierarchy option, as highlighted in the image below.
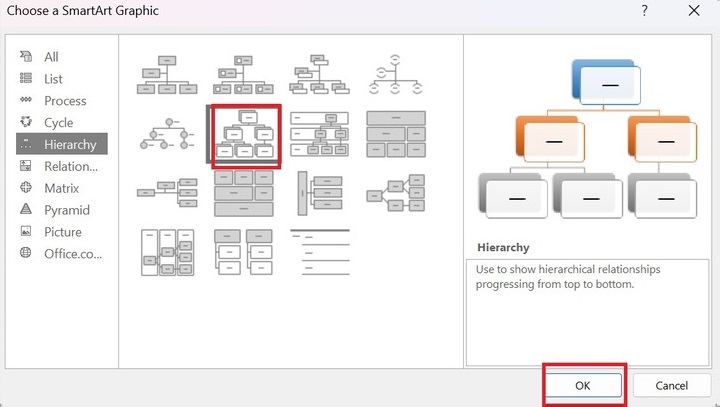
Step 3 − Once you choose the hierarchy graphic option, it will be inserted into Microsoft Excel. Hierarchy graphics generally depict relationships progressing from the top to the bottom.
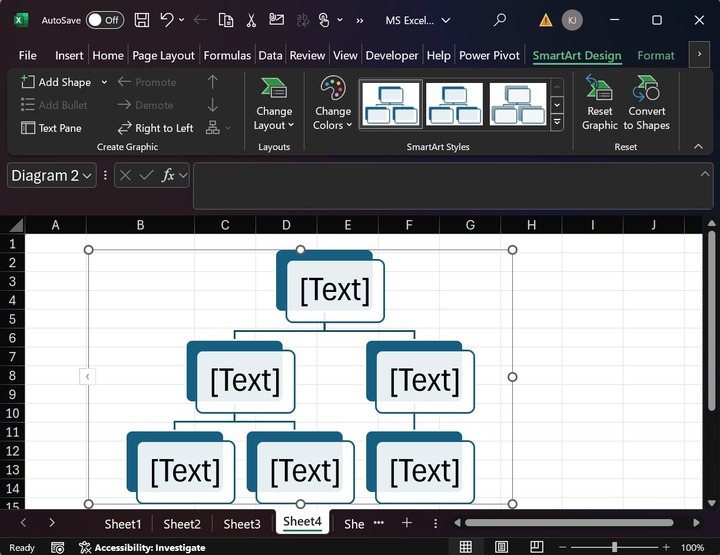
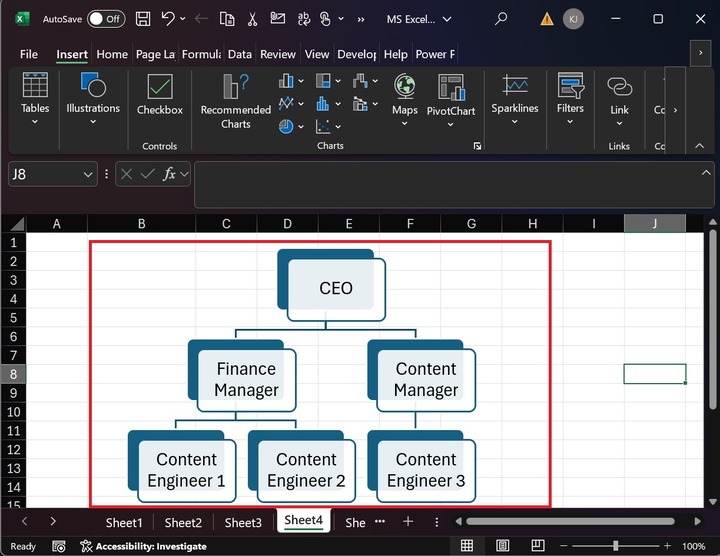
Now, you can edit the default text of the Hierarchy graphics. For example, the IT company hierarchy is like the CEO, Marketing Manager, and Content Manager on the same horizontal line and the Content Engineers team on the bottom line.
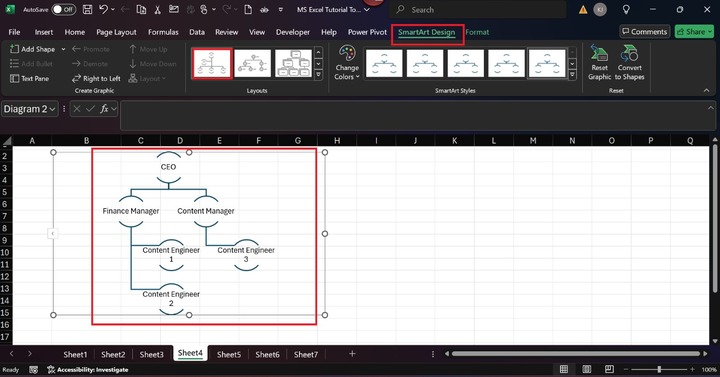
Step 4 − You may change the Formatting of the Hierarchy graphic through the SmartArt design tab. The SmartArt design includes various groups, such as Create Graphics, Layouts, SmartArt Styles, and Reset.
Let's say you want to change the Layout of the Hierarchy graphic. To achieve this, you can select the Hierarchy graphics. In the SmartArt Design tab, select the "Half circle Organization Chart" under the Layouts group.
Step 5 − Select "Brick Scene" under SmartArt Styles to change the default graphics style.
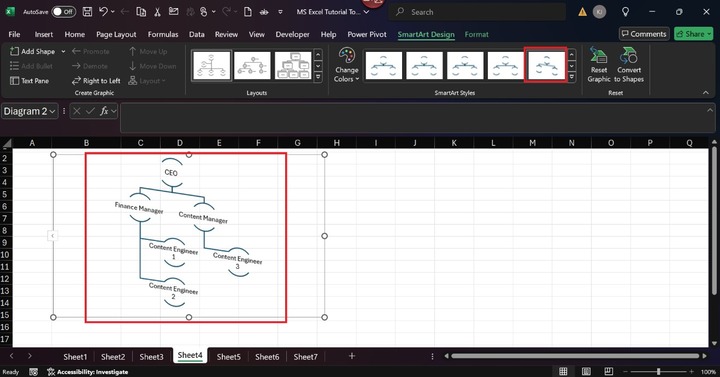
Expand the "Change Color" tile to make it more colorful and select the "Colorful range Accent Colors 3 to 4" option from the drop-down list.
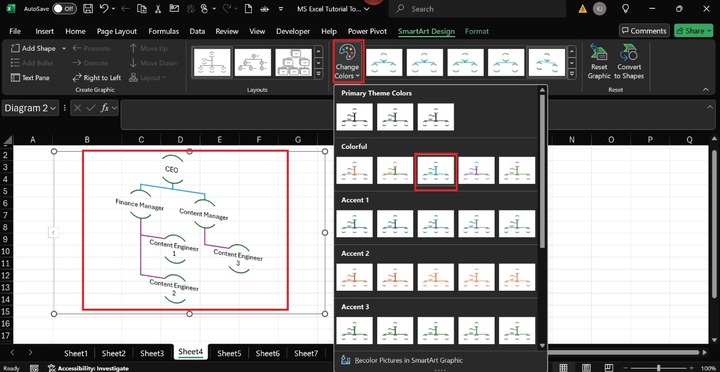
Therefore, we have changed the formatting of the Hierarchy graphics.
Add SmartArt Graphics with Image
SmartArt features allow you to add multiple pictures from various resources. Various steps are depicted below to insert the SmartArt graphics with image options.
Step 1 − Go to the Insert tab, expand the "Illustrations" tile, and select the "SmartArt" option from the drop-down menu.
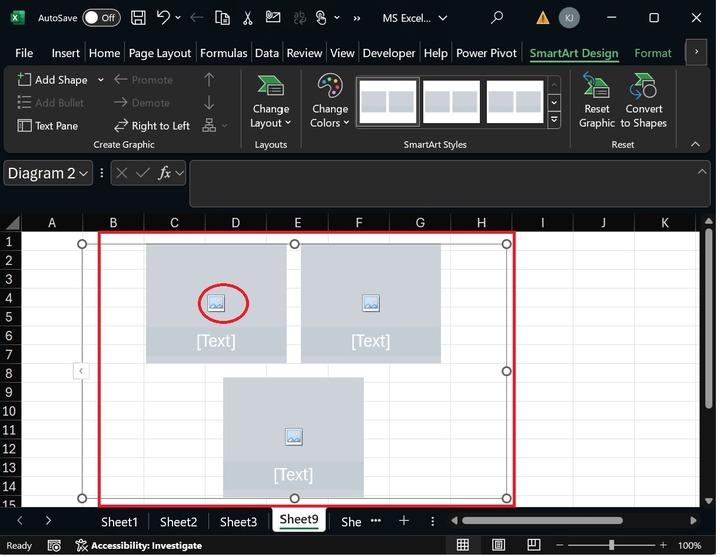
Step 2 − Afterward, in the "Choose a SmartArt Graphic" dialog box, select the "Picture" category, choose the "Bending Picture Semi-Transparent Text," and click the OK button.
Now, the default picture has been added to the worksheet. Double-click on the first image icon.
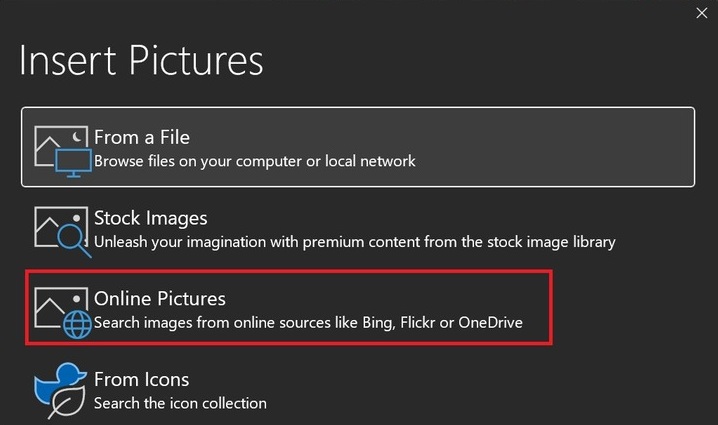
The "Insert Pictures" dialog box will appear. Select Online Pictures from the drop-down list. You may insert pictures through various options, such as "From a file," "Stock Images," "Online Pictures," and "From Icons."
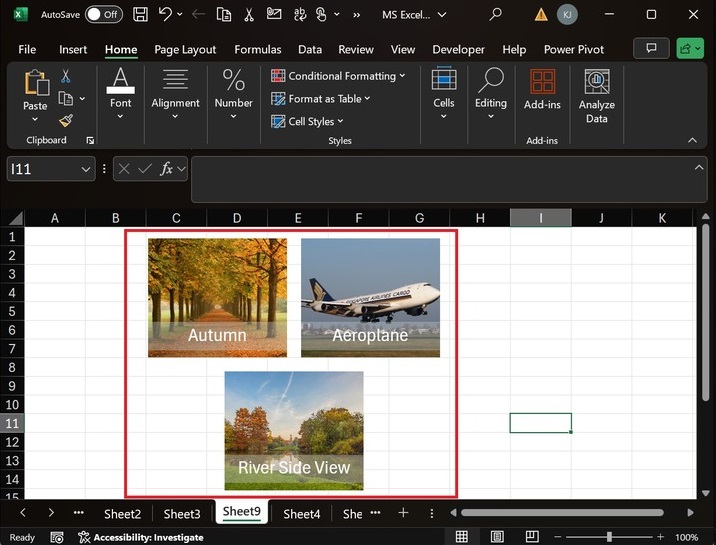
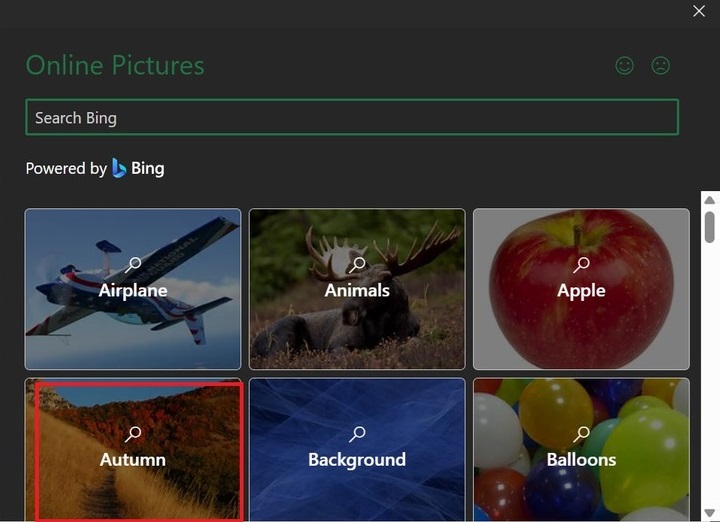
Various categories are shown in the "Online Pictures" dialog box. You may choose the "Autumn" category and select the first autumn image.
Therefore, the Autumn image has been inserted into the first picture. You can now also write "Autumn" at the bottom of the textbox.
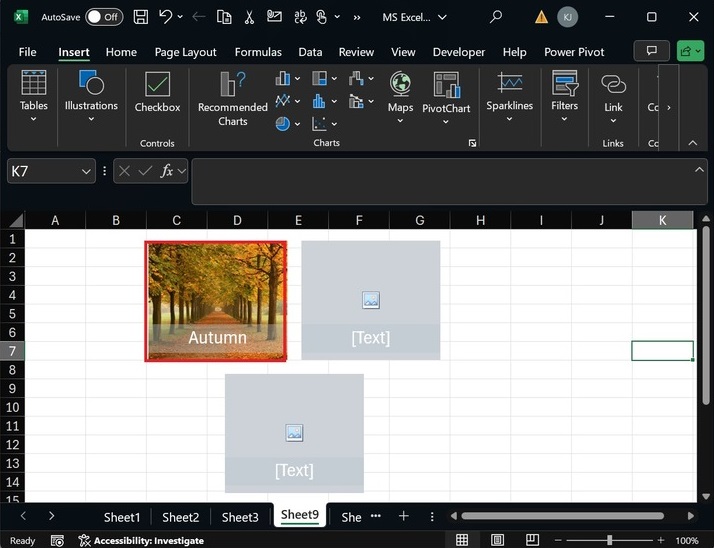
Similarly, as in the previous step, you can insert the pictures in the remaining image boxes.