- Discrete Mathematics - Home
- Discrete Mathematics Introduction
- Mathematical Statements and Operations
- Atomic and Molecular Statements
- Implications
- Predicates and Quantifiers
- Sets
- Sets and Notations
- Relations
- Operations on Sets
- Venn Diagrams on Sets
- Functions
- Surjection and Bijection Functions
- Image and Inverse-Image
- Mathematical Logic
- Propositional Logic
- Logical Equivalence
- Deductions
- Predicate Logic
- Proof by Contrapositive
- Proof by Contradiction
- Proof by Cases
- Rules of Inference
- Group Theory
- Operators & Postulates
- Group Theory
- Algebric Structure for Groups
- Abelian Group
- Semi Group
- Monoid
- Rings and Subring
- Properties of Rings
- Integral Domain
- Fields
- Counting & Probability
- Counting Theory
- Combinatorics
- Additive and Multiplicative Principles
- Counting with Sets
- Inclusion and Exclusion
- Bit Strings
- Lattice Path
- Binomial Coefficients
- Pascal's Triangle
- Permutations and Combinations
- Pigeonhole Principle
- Probability Theory
- Probability
- Sample Space, Outcomes, Events
- Conditional Probability and Independence
- Random Variables in Probability Theory
- Distribution Functions in Probability Theory
- Variance and Standard Deviation
- Mathematical & Recurrence
- Mathematical Induction
- Formalizing Proofs for Mathematical Induction
- Strong and Weak Induction
- Recurrence Relation
- Linear Recurrence Relations
- Non-Homogeneous Recurrence Relations
- Solving Recurrence Relations
- Master's Theorem
- Generating Functions
- Graph Theory
- Graph & Graph Models
- More on Graphs
- Planar Graphs
- Non-Planar Graphs
- Polyhedra
- Introduction to Trees
- Properties of Trees
- Rooted and Unrooted Trees
- Spanning Trees
- Graph Coloring
- Coloring Theory in General
- Coloring Edges
- Euler Paths and Circuits
- Hamiltonion Path
- Boolean Algebra
- Boolean Expressions & Functions
- Simplification of Boolean Functions
- Advanced Topics
- Number Theory
- Divisibility
- Remainder Classes
- Properties of Congruence
- Solving Linear Diophantine Equation
- Useful Resources
- Quick Guide
- Useful Resources
- Discussion
Venn Diagrams on Sets in Discrete Mathematics
To visualize sets, one of the most useful methods is Venn diagrams. Venn diagrams represent sets as circles, with overlapping regions showing common elements between the sets. In this article we will see the use of Venn diagrams in set operations, understand how they provide a visual approach to union, intersection, difference, and more with examples for a better understanding.
What are Venn Diagrams?
A Venn diagram is a tool to represent sets and their relationships with one another. Each set is typically represented as a circle, and the relationships between sets are shown by how these circles overlap.
- In a Venn diagram, each circle represents a set. When two or more sets overlap, the intersection (shared elements) is displayed in the overlapping region of the circles. Elements unique to each set are located in the non-overlapping parts.
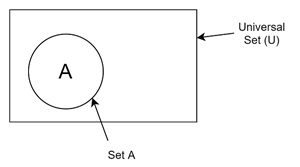
- Often, the sets are contained within a rectangle that represents the universal set, denoted as U, which includes all the possible elements under consideration.
Take a look at the following Venn diagram. Here, we have the rectangle region as the Universe and there is a set A inside universe. All set are subset of the Universe.
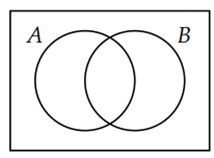
Here, we get one example of overlapping sets. A and B are overlapping.
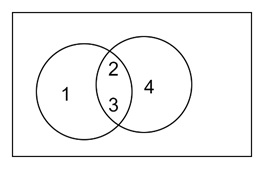
Example
Let us consider two sets −
- Set A = {1, 2, 3}
- Set B = {2, 3, 4}
Using a Venn diagram, we draw two overlapping circles. The intersection (shared part) would be {2, 3} and the non-overlapping parts would be {1} for A and {4} for B.
Let us now check some operations that are usually done on Venn Diagrams.
Union of Sets
The union of two sets A and B denoted as (A ∪ B, is the set of elements that are in either A, B, or both. In a Venn diagram, the union is represented by shading the entire area covered by both circles.
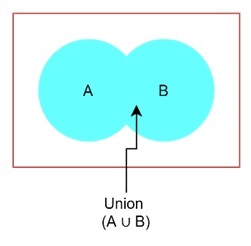
In the Venn diagram, both circles would be completely shaded.
Intersection of Sets
The intersection of two sets A and B, denoted by A ∩ B, is the set of elements common to both sets. In a Venn diagram, the intersection is shown by shading only the overlapping region of the circles.
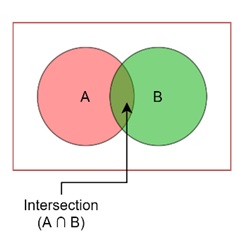
In the Venn diagram, only the overlapping part of the two circles would be shaded.
Difference of Sets
The difference of two sets A and B, denoted by A − B, is the set of elements that are in A but not in B. In a Venn diagram, the difference is represented by shading only the part of A that does not overlap with B.
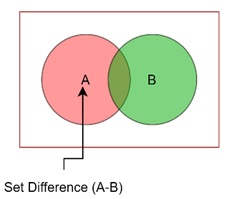
In the Venn diagram, only the non-overlapping part would be shaded.
Complement of a Set
The complement of a set A, denoted by A′ of AC, contains all the elements that are not in A. The complement depends on the universal set U, which includes all possible elements.
In a Venn diagram, the complement is represented by shading the area outside the circle of set A.
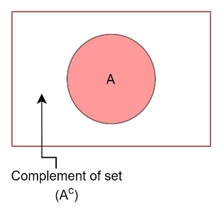
In the Venn diagram, the area outside of the circle representing set AAA would be shaded.
Symmetric Difference
The symmetric difference between two sets A and B, denoted by AB, is the set of elements that are in either A or B, but not in both. In a Venn diagram, this is represented by shading the non-overlapping parts of both circles.
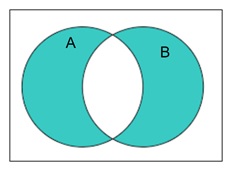
In the Venn diagram, the parts of A and B that do not overlap would be shaded.
Venn Diagrams with More Than Two Sets
Venn diagrams are not limited to two sets. When we work with three sets or more, the diagrams become more complex, but the basic principles remain the same.
We simply add more circles to represent additional sets, and their intersections and unions can be observed visually.
Example with Three Sets
Let us consider three sets −
- A = {1, 2}
- B = {2, 3}
- C = {3, 4}
In its Venn diagram, the intersection of all three sets, A ∩ B ∩ C, would be empty (since no element is in all three sets).
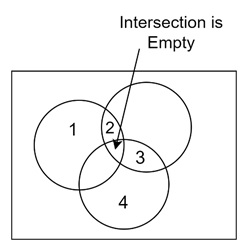
The pairwise intersections, such as A ∩ B = {2} and B ∩ C = {3}, would be shown by overlapping regions of the circles.
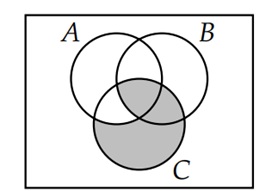
Another complicated example could be: (B ∩ C) U (C ∩ AC), this could be represented as the following Venn diagram:
Applications of Venn Diagrams
As we have understood, the Venn diagrams are useful in many fields, especially in probability theory, logic, statistics, and computer science.
- Visualizing logical relationships − By using overlapping areas, Venn diagrams simplify understanding relationships between different sets.
- Simplifying complex set operations − In problems involving multiple sets and operations like union, intersection, and difference, Venn diagrams offer an intuitive way to see results.
- Solving word problems − In set theory, problems often ask for the number of elements in unions, intersections, or complements, and Venn diagrams help visualize and solve these problems quickly.
Using Venn Diagrams to Solve Problems
Venn diagrams are useful when solving problems that involve the cardinality of sets. Consider a scenario where we know the size of several sets and their intersections. By placing these numbers in a Venn diagram, we can easily figure out how many elements are in each region.
Example
Let us see some examples to understand these idea −
- Set A has 10 elements,
- Set B has 15 elements, and
- Their intersection has 5 elements.
Here, we can use a Venn diagram to calculate the number of elements in A ∪ B, by adding the numbers in each region −
$$\mathrm{|A \:\cup\: B| \:=\: (10 \:-\: 5) \:+\: (15 \:-\: 5) \:+\: 5 \:=\: 20}$$
This is a typical use of Venn diagrams in solving real-world problems.
Conclusion
In this chapter, we explained how Venn diagrams are used to represent sets and their operations in discrete mathematics. We discussed fundamental set operations such as union, intersection, difference, and complement, and illustrated how they are visually represented in Venn diagrams.
We also looked at how to use Venn diagrams for more complex operations like symmetric difference and working with three sets. Finally, we understood their practical applications in solving set-related problems.