- Power BI - Home
- Power BI - Introduction
- Power BI - Installation Steps
- Power BI - Architecture
- Power BI Desktop
- Power BI - Desktop
- Power BI - Desktop Window
- Power BI Service
- Power BI - Window Supported Browsers
- Power BI - Generating Reports
- Power BI Desktop Service
- Power BI - Desktop vs Service
- Power BI - Supported Data Sources
- Power BI - Comparison Tools
- Power Query Editor
- Power Query Editor - Introduction
- Power Query Editor - Data Discrepancy
- Power Query Editor - Merge Queries (Part 1)
- Power Query Editor - Merge Queries (Part 2)
- Power BI - Develop Star Schema
- Data Modeling Concepts
- Power BI - Data Modeling
- Power BI - Manage Relationships
- Power BI - Cardinality
- Power BI - Dashboard Options
- Power BI Report Visualizations
- Power BI - Visualization Options
- Power BI - Visualization Charts
- Power BI - Stacked Bar Chart
- Power BI - Stacked Column Chart
- Power BI - Clustered Chart
- Power BI - 100% Stacked Chart
- Power BI - Area Chart and Stacked Area Chart
- Power BI - Line and Stacked Column Chart
- Power BI - Line and Clustered Column Chart
- Power BI - Ribbon Chart
- Power BI - Table and Matrix Visuals
- Power BI Map Visualizations
- Power BI - Creating Map Visualizations
- Power BI - ArcGIS Map
- Power BI Miscellaneous
- Power BI - Waterfall Charts
- Funnel Charts and Radial Gauge Chart
- Power BI - Scatter Chart
- Power BI - Pie Chart and Donut Chart
- Power BI - Card and Slicer Visualization
- Power BI - KPI Visual
- Power BI - Smart Narrative Visual
- Power BI - Decomposition Tree
- Power BI - Paginated Report
- Power BI - Python Script & R Script
- Power BI - Multi-row Card
- Power BI - Power Apps & Power Automate
- Power BI - Excel Integration
- Power BI Dashboard
- Power BI - Sharing Dashboards
- Power BI Sales Production Dashboard
- Power BI - HR Analytics Dashboard
- Power BI - Customer Analytics Dashborad
- Power BI - DAX Basics
- Power BI - Administration Role
- Power BI - DAX Functions
- Power BI - DAX Text Functions
- Power BI - DAX Date Functions
- Power BI - DAX Logical Functions
- Power BI - DAX Counting Functions
- Power BI - Depreciation Functions
- Power BI - DAX Information Functions
Power BI - DAX Basics
In this chapter, you will learn how to use various DAX functions in Power BI.
DAX Introduction
DAX (Data Analysis Expressions) is a formula expression language and can be used in different BI and visualization tools. DAX is also known as function language, where the full code is kept inside a function. DAX programming formula contains two data types: Numeric and Other. Numeric includes - integers, currency, and decimals, while Other includes: string and binary objects.
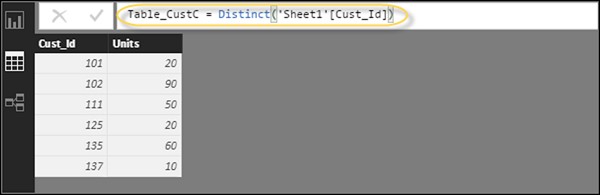
Following is an example of the DAX formula, which uses a function to calculate a column in a table.
DAX function can also include other functions, conditional statements, and value references.
DAX Functions
In Power BI, you can use different function types to analyze data and create new columns and measures. It includes functions from different categories such as −
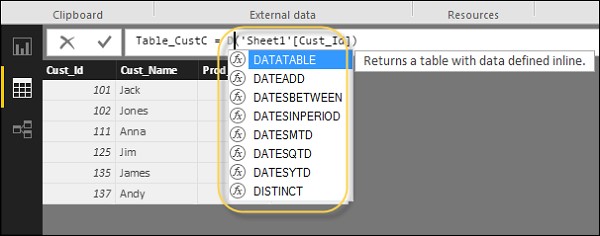
Power BI provides an easy way to see the list of all functions. When you start typing your function in the formula bar, you can see the list of all functions starting with that alphabet.
DAX Aggregate Functions
DAX has several aggregate functions, such as −
- MIN
- MINA
- MINX
- MAX
- MAXA
- MAXX
- Average
- AverageA
- AverageX
- SUM
- SUMX
- PRODUCT
- PRODUCTX
DAX TEXT Functions
- LEFT
- RIGHT
- UPPER
- LOWER
- FORMAT
- FIND
- BLANK
- LEN
- CONCATENATE
- CONCATENATEX
- MID
- TRIM
- REPLACE
- EXACT
- SUBSTITUTE
DAX DATE Functions
- DATE
- DATEDIFF
- DATEVALUE
- CALENDER
- YEAR
- YEARFRAC
- HOUR
- WEEKDAY
- WEEKNUM
- NOW
- EOMONTH
DAX Logical Functions
Following is the collection of Logical functions −
- AND
- OR
- NOT
- IF
- IFERROR
- COALESCE
- SWITCH
- TRUE
- FALSE
- BITXOR
- BITAND
- BITLSHIFT
- EAGER
DAX Counting Functions
Other counting functions in DAX include −
- DISTINCTCOUNT
- COUNT
- COUNTA
- COUNTROWS
- COUNTBLANK
DAX INFORMATION Functions
- CONTAINS
- CONTAINSSTRING
- CONTAINSROW
- COLUMNSTATISTICS
- CONTAINSSTRINGEXACT
- HASONEFILTER
- HASONEVALUE
- ISBLANK
- ISNUMBER
- ISLOGICAL
- ISAFTER
- ISSUBTOTAL
- SELECTEDMEASURE
- ISTEXT
- ISNONTEXT
- ISERROR
- NONVALUE
DAX Calculation Types
In Power BI, you can create two primary calculations using DAX −
- Calculated columns
- Calculated measures
When you navigate to the Modeling tab, you can see a New Column option at the top of the screen. This also opens the formula bar where you can enter DAX formula to perform the calculation. DAX - Data Analysis Expression is a powerful language used in Excel to perform calculations. You can also rename the column by changing the Column text in the formula bar.
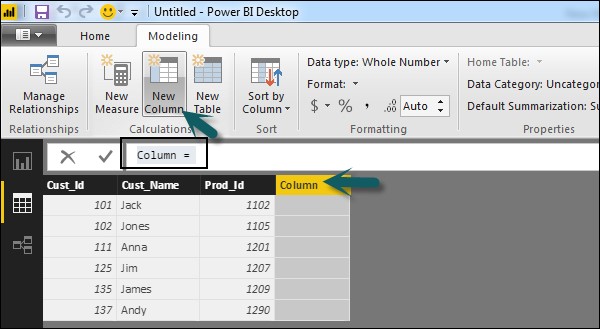
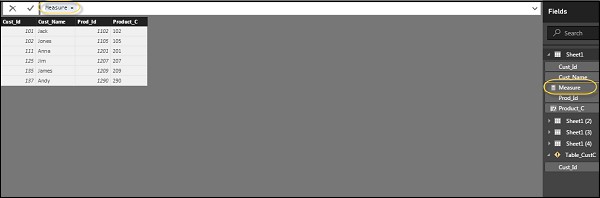
In the following example, we have created a new column: Product Code (Product_C), which is derived from the last 3 characters of Prod_Id column. Following is the formula −
Product_C = RIGHT( Sheet1[Prod_Id],3)
To create a calculated measure, navigate to New Measure tab under Modeling. This will add a new object under the Fields tab with the name Measure.
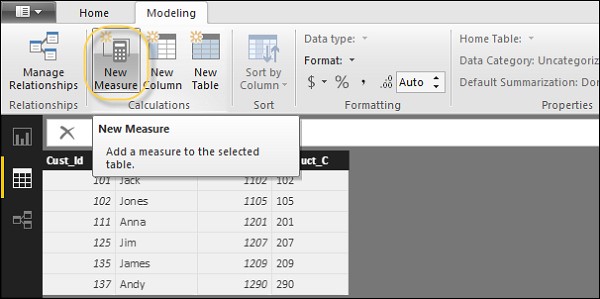
You can write DAX formula to calculate the value of the new measure, as we did for the new calculated column.