- Power BI - Home
- Power BI - Introduction
- Power BI - Installation Steps
- Power BI - Architecture
- Power BI Desktop
- Power BI - Desktop
- Power BI - Desktop Window
- Power BI Service
- Power BI - Window Supported Browsers
- Power BI - Generating Reports
- Power BI Desktop Service
- Power BI - Desktop vs Service
- Power BI - Supported Data Sources
- Power BI - Comparison Tools
- Power Query Editor
- Power Query Editor - Introduction
- Power Query Editor - Data Discrepancy
- Power Query Editor - Merge Queries (Part 1)
- Power Query Editor - Merge Queries (Part 2)
- Power BI - Develop Star Schema
- Data Modeling Concepts
- Power BI - Data Modeling
- Power BI - Manage Relationships
- Power BI - Cardinality
- Power BI - Dashboard Options
- Power BI Report Visualizations
- Power BI - Visualization Options
- Power BI - Visualization Charts
- Power BI - Stacked Bar Chart
- Power BI - Stacked Column Chart
- Power BI - Clustered Chart
- Power BI - 100% Stacked Chart
- Power BI - Area Chart and Stacked Area Chart
- Power BI - Line and Stacked Column Chart
- Power BI - Line and Clustered Column Chart
- Power BI - Ribbon Chart
- Power BI - Table and Matrix Visuals
- Power BI Map Visualizations
- Power BI - Creating Map Visualizations
- Power BI - ArcGIS Map
- Power BI Miscellaneous
- Power BI - Waterfall Charts
- Funnel Charts and Radial Gauge Chart
- Power BI - Scatter Chart
- Power BI - Pie Chart and Donut Chart
- Power BI - Card and Slicer Visualization
- Power BI - KPI Visual
- Power BI - Smart Narrative Visual
- Power BI - Decomposition Tree
- Power BI - Paginated Report
- Power BI - Python Script & R Script
- Power BI - Multi-row Card
- Power BI - Power Apps & Power Automate
- Power BI - Excel Integration
- Power BI Dashboard
- Power BI - Sharing Dashboards
- Power BI Sales Production Dashboard
- Power BI - HR Analytics Dashboard
- Power BI - Customer Analytics Dashborad
- Power BI - DAX Basics
- Power BI - Administration Role
- Power BI - DAX Functions
- Power BI - DAX Text Functions
- Power BI - DAX Date Functions
- Power BI - DAX Logical Functions
- Power BI - DAX Counting Functions
- Power BI - Depreciation Functions
- Power BI - DAX Information Functions
Power BI - Smart Narrative Visual
A non-technical person can view your story but what is happening inside it is difficult to generalize. Smart narrative assists users in gathering the main key aspects of your story to get to know the summary of the supported visuals where business users better elaborate the insights to keen users.
Dataset − You need to import the two workbooks "D:\Dataset_excel\sl.xlsx" and "D:\sales executive.xlsx" in the BI Desktop.
How to Generate a Smart Narrative?
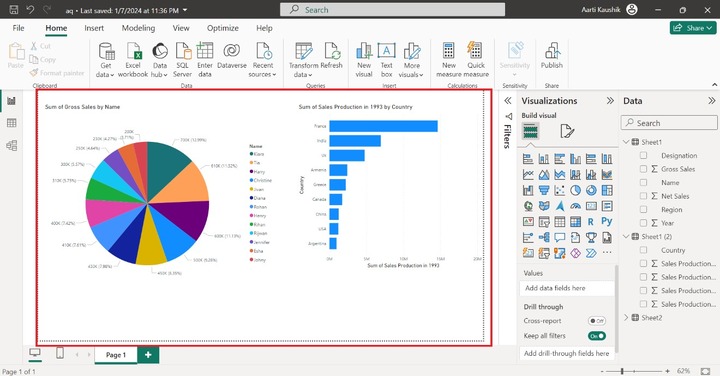
Suppose you have two visuals one is a pie chart which shows the "Sum of Gross Sales by Name" and the other is "Sum of Sales Production in 1993 by country" on the canvas.
Two ways to utilize the Smart Narrative in the BI desktop −
- You can right-click on the specific visual and select the summarize option.
- You can choose the "Smart Narrative" visual from the Data pane.
Summarize Option
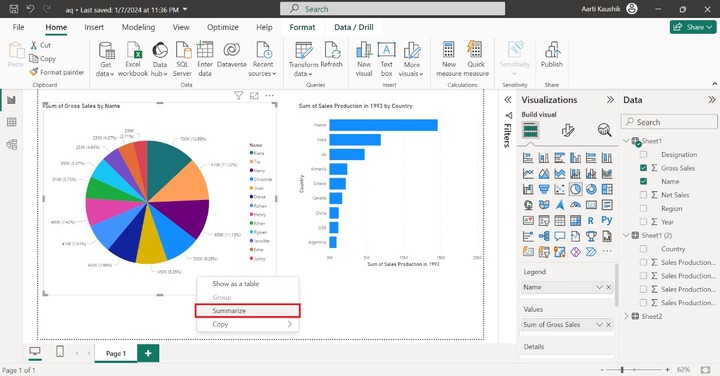
You can right-click on the Pie chart and select the "Summarize" option from the list.
As you can view in the screenshot, the summary of the pie chart is populated on the smart narrative visual. If you are eager to get extensive information about the pie chart, then you may click on the "+ Value" where more related queries can be added.
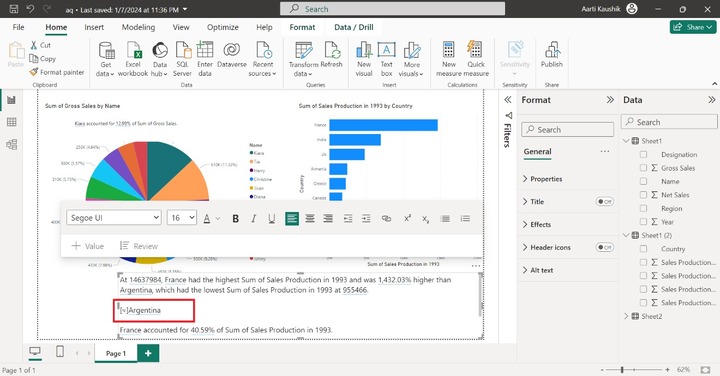
Similarly, you can right-click on another visual and choose "Summarize" to get in-depth insights into this visual.

You can customize the generated summary by modifying its default formatting like Font style, alignment, font size, and so on. You may also append the new calculations or new values dynamically. You can give the specific name "#v2" for the dynamic value and click on "Save".
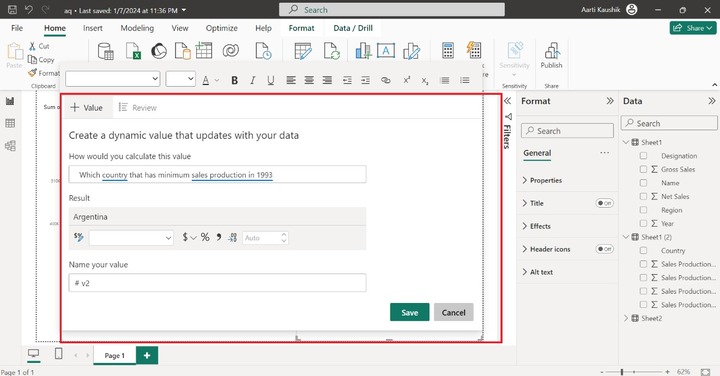
As you can observe in the screenshot, the new insight has been appended to the Summary. Here, Argentina country had minimum Sales production in 1993.
Utilizing the Smart Narrative Visual
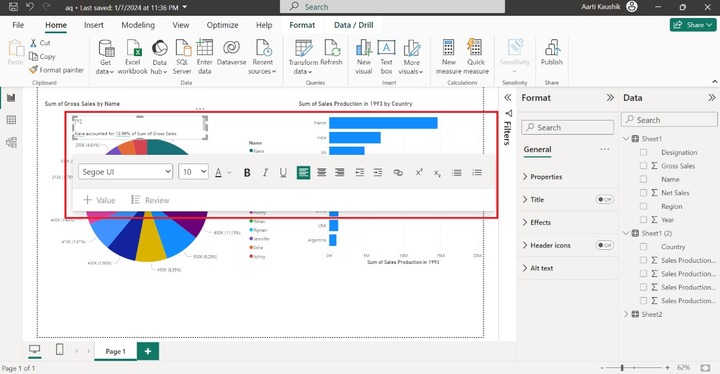
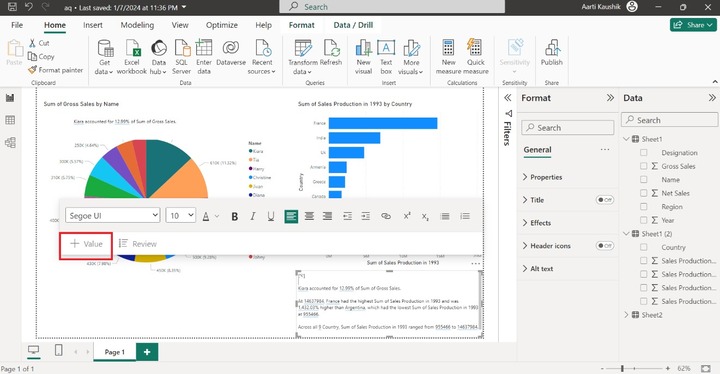
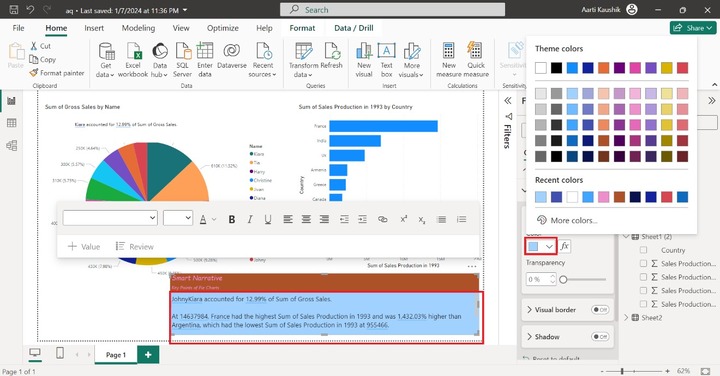
The alternative way is to choose the Smart Narrative visual from Visualizations. It populates the essential key points of both visuals.
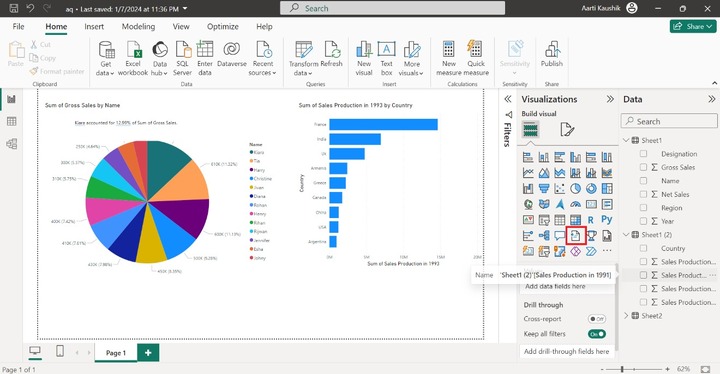
As you can notice in the screenshot, the summary of a pie chart and column chart has been displayed on the Report canvas.
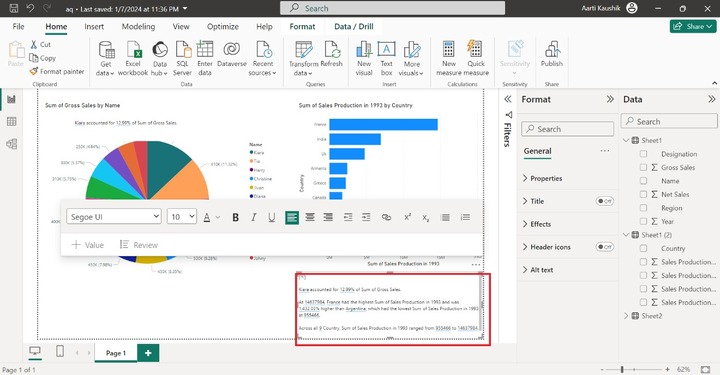
Lets append new value to the Smart Narrative. You may click on the "+ Value" sign as highlighted in the below screenshot −
You can enter the new value and write the specific name like "v6" for the new dynamic query and then select the "Save".
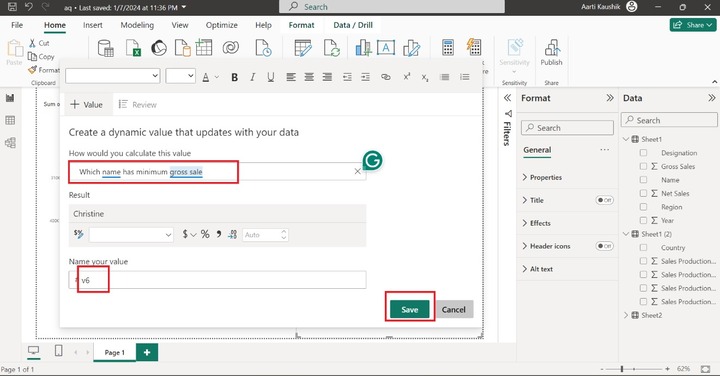
As you can conclude from the screenshot, Johny has a minimum gross sale.

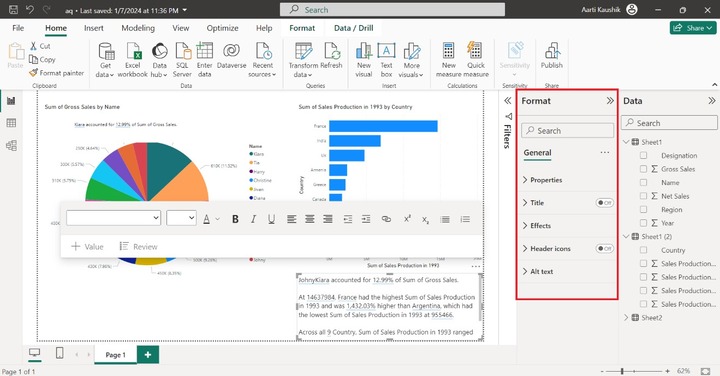
How to Format the Smart Narrative Visual?
You can customize the designated Smart Narrative Visual by utilizing the Format pane. Various options like Properties, Title, Effects, Header icons, and Alt text are listed in the Format pane.
Properties
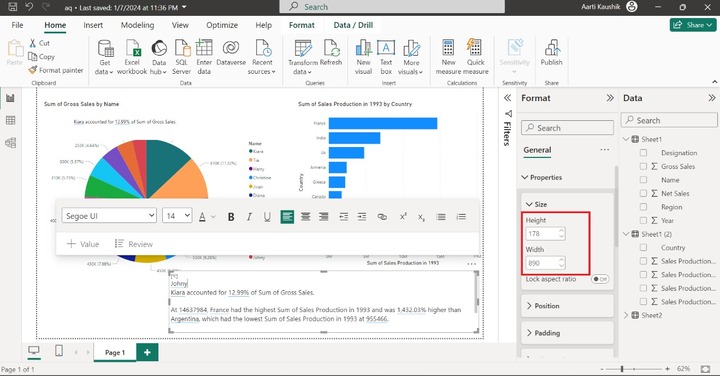
You may expand the "Properties" tile where "Size", "Position", "Padding" and "Advanced options" are available.
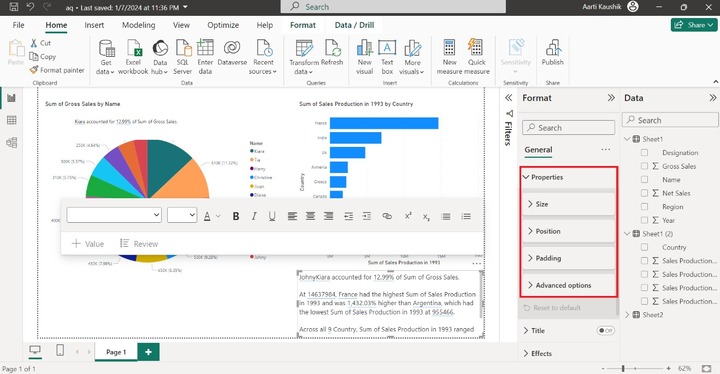
You can modify the visual height and width, expand the Size tile, and set the Height to 178 and Width to 890 under the Size section.
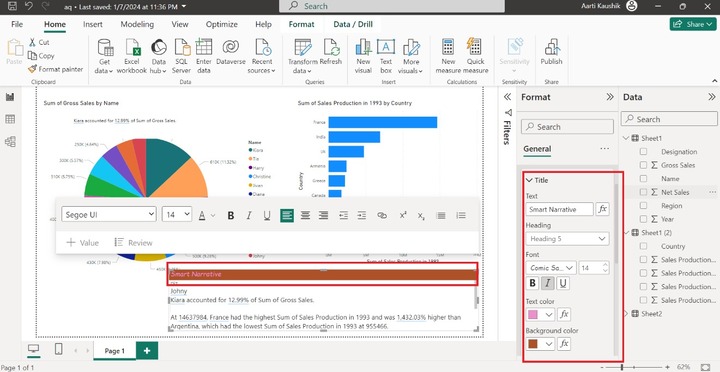
Title
You can turn on the Title button and specify the desired title "Smart Narrative" under "Text", set the Heading to "Heading 5", change the Font style to "Comic Sans MS", increase the size that is 14, and alter the text color and background color of it. As you can observe in the screenshot, the stunning title has been appended.
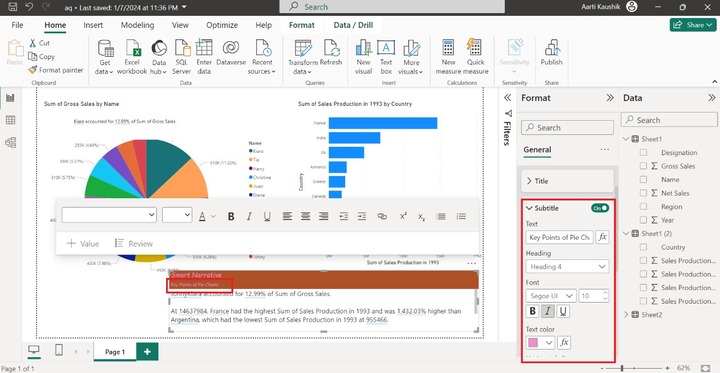
Similarly, you can turn on the Subtitle button, write the title "Key Points of Pie Chart" and alter the other formatting.
Effects
It comprises "Background", "Visual border" and "Shadow". You can expand the "Effects" tile and turn on the Background color. You can select the specified color "a0d1ff" from the given list under "Color" section.
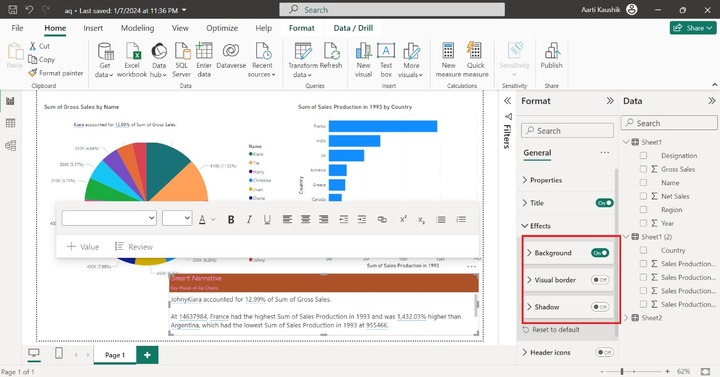
As you can observe in the screenshot, the background color of the Smart Narrative visual has been changed.
You can also turn on the "Visual border" and "Shadow" buttons.
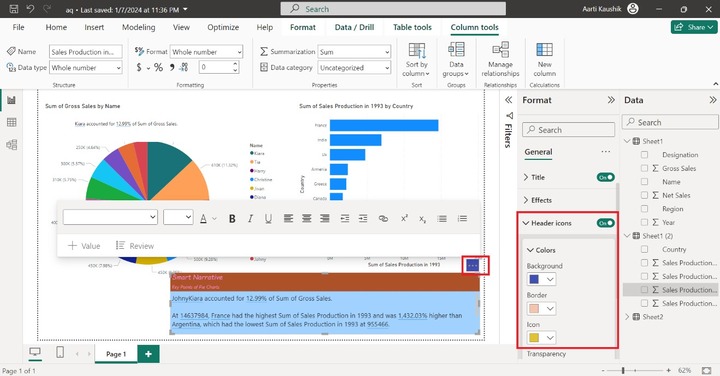
Header Icons
It consists of "Color" and "Icons" subsection. To utilize this "Header Icons" option, you may turn on the "Header icons" and expand the "Color" tile, and change the desired Background, Border, and Icon colors as shown in the screenshot.
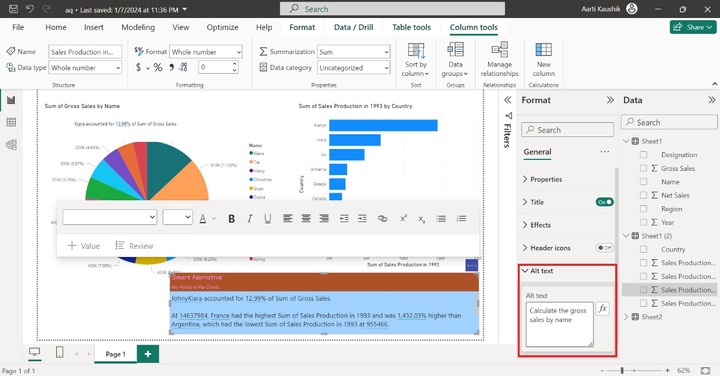
Alt Text
The "Alt text" section is applicable if the narrator is installed and activated on the laptop. You can click on the "Alt text" and enter a specific statement like "Calculate the gross sales by name" in the textbox and this statement will be dictated by the narrator.