- Power BI - Home
- Power BI - Introduction
- Power BI - Installation Steps
- Power BI - Architecture
- Power BI Desktop
- Power BI - Desktop
- Power BI - Desktop Window
- Power BI Service
- Power BI - Window Supported Browsers
- Power BI - Generating Reports
- Power BI Desktop Service
- Power BI - Desktop vs Service
- Power BI - Supported Data Sources
- Power BI - Comparison Tools
- Power Query Editor
- Power Query Editor - Introduction
- Power Query Editor - Data Discrepancy
- Power Query Editor - Merge Queries (Part 1)
- Power Query Editor - Merge Queries (Part 2)
- Power BI - Develop Star Schema
- Data Modeling Concepts
- Power BI - Data Modeling
- Power BI - Manage Relationships
- Power BI - Cardinality
- Power BI - Dashboard Options
- Power BI Report Visualizations
- Power BI - Visualization Options
- Power BI - Visualization Charts
- Power BI - Stacked Bar Chart
- Power BI - Stacked Column Chart
- Power BI - Clustered Chart
- Power BI - 100% Stacked Chart
- Power BI - Area Chart and Stacked Area Chart
- Power BI - Line and Stacked Column Chart
- Power BI - Line and Clustered Column Chart
- Power BI - Ribbon Chart
- Power BI - Table and Matrix Visuals
- Power BI Map Visualizations
- Power BI - Creating Map Visualizations
- Power BI - ArcGIS Map
- Power BI Miscellaneous
- Power BI - Waterfall Charts
- Funnel Charts and Radial Gauge Chart
- Power BI - Scatter Chart
- Power BI - Pie Chart and Donut Chart
- Power BI - Card and Slicer Visualization
- Power BI - KPI Visual
- Power BI - Smart Narrative Visual
- Power BI - Decomposition Tree
- Power BI - Paginated Report
- Power BI - Python Script & R Script
- Power BI - Multi-row Card
- Power BI - Power Apps & Power Automate
- Power BI - Excel Integration
- Power BI Dashboard
- Power BI - Sharing Dashboards
- Power BI Sales Production Dashboard
- Power BI - HR Analytics Dashboard
- Power BI - Customer Analytics Dashborad
- Power BI - DAX Basics
- Power BI - Administration Role
- Power BI - DAX Functions
- Power BI - DAX Text Functions
- Power BI - DAX Date Functions
- Power BI - DAX Logical Functions
- Power BI - DAX Counting Functions
- Power BI - Depreciation Functions
- Power BI - DAX Information Functions
Power Query Editor - Introduction
What is a Power Query Editor?
Power Query Editor is a special ingredient of Power BI Desktop that is used to profile, refine, and clean the data. You may apply certain constraints to identify errors and rectify them to create a new dataset.
Need for a Power Query Editor
If you are playing with large datasets and creating reports directly after loading the datasets, you will develop an inaccurate report that is of no use. Large datasets contain lots of errors, like incorrect values, null values, ambiguous values, duplicate columns, etc. The Power Query Editor is a component where you identify the impurities in your dataset and eliminate all anomalies to reshape the dataset.
Various Options to Transform Data in Power Query Editor
There are various ways to transform data. First, navigate to the Home tab and select the required options like Split column, Group by, Replace Value, and Alter data type of the selected column from the "Transform" group. Another way is to select the Transform tab where numerous options are categorized into various groups. The manage column is a group where you can remove duplicate columns.
Any Column Group
- You can identify the data type of the selected column and can change its data type to your needs.
- You may also change the name of the specified column.
- You can replace incorrect and error values with correct values. Another way is to interchange the present value with the new values in any column.
- Eliminate duplicate values and empty values and fill empty values.
- Select the "Pivot column" to create new columns using the names in the currently chosen column.
- Choose the "Unpivot column" to develop the Attribute-Value pair for the selected/unselected column.
- Convert the specified column into a list.
- Consolidate rows in the dataset depending on the values in the specified column.
- Alter the invalid data types of columns to the correct data type.
Text Columns Group
- Select the "Split column" tile embedded in the Text column group under the Transform tab. You may Split the Column by a delimiter, by position, by the number of characters, by uppercase to lowercase and lowercase to uppercase, digit to non-digit and vice versa, etc.
- You can choose the Format tile to convert the text either into lowercase or uppercase, eliminating the whitespaces from the column s field value, and deleting nonprintable characters in the column.
- Select "Parse" to retrieve JSON/ XML data into table form.
Number Column Group
- You can conduct the statistical operation for the descriptive analysis of numeric data by selecting the "Statistics" tile.
- The fundamental arithmetic operations like Modulo, Percentages of, Addition, multiplication, and Subtraction are also performed by choosing the "Standard" tile.
- You can also conduct Scientific operations like Factorial, Logarithmic, Exponent, Power, square root, etc by choosing the "Scientific" tile.
- The basic trigonometric functions like Arctangent, Sine, Cosine, Tangent, and so on are also performed in the column s value.
- You may perform rounding of large decimal numbers through options like round down, round up, and round.
- You can alter the column s field value into even or odd according to the field sign value.
Date & Time Column Group
- Alter data and time values to the valid dates in the Date/Time columns.
- Consolidate data and time values from defined columns into new columns.
- You may also format duration values.
Major Steps to Transform Data into Power Query Editor
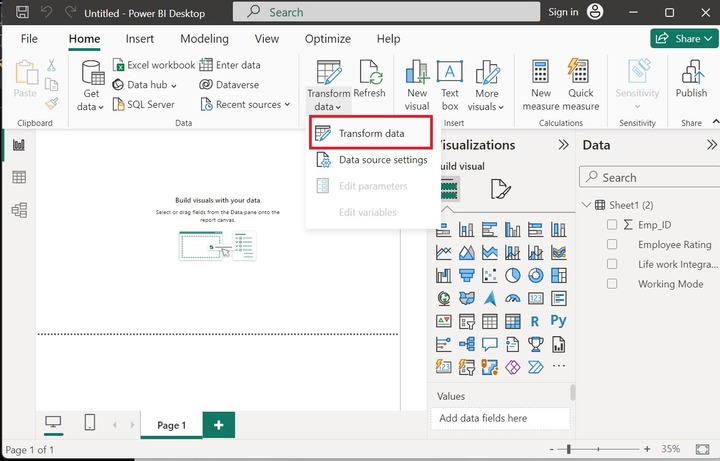
Once you load the data into Power BI and click on the "Transform data" from the Queries group.
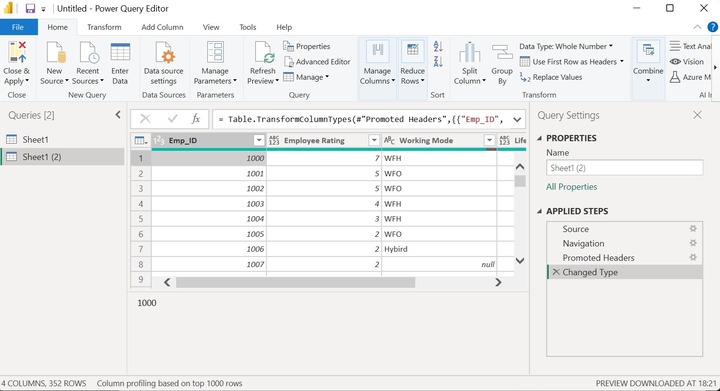
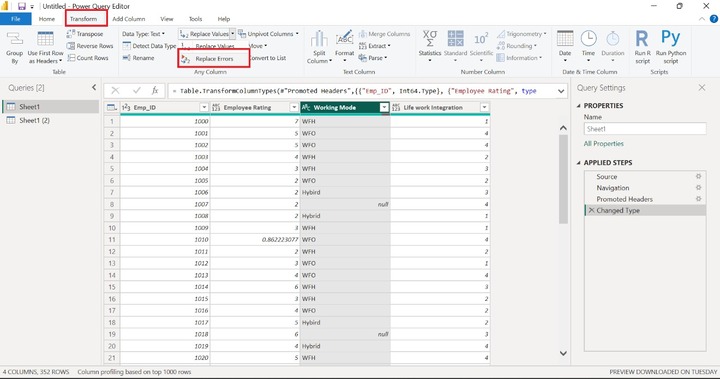
The Power Query Editor window will open where you can transform the loaded data. The third column "Working Mode" has so many null values.
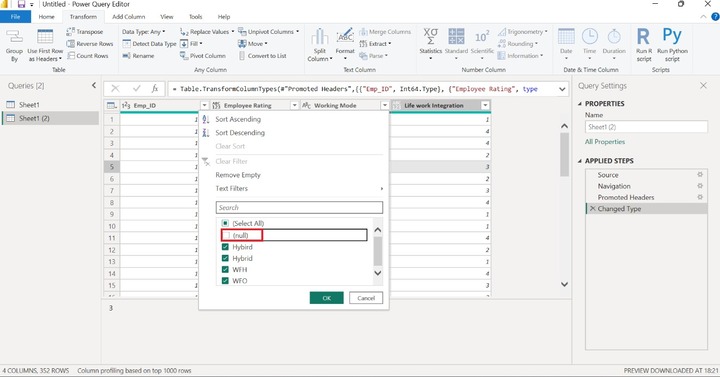
Click on the "Working Mode" ▼ untick the "null" values and click OK.
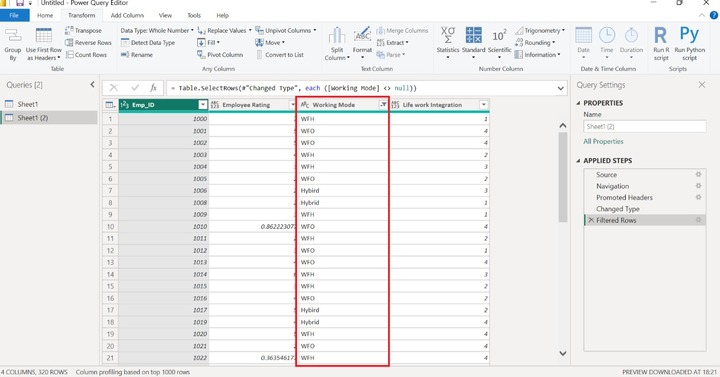
The null values were deleted from the selected column and the new dataset is generated that contains no empty values.
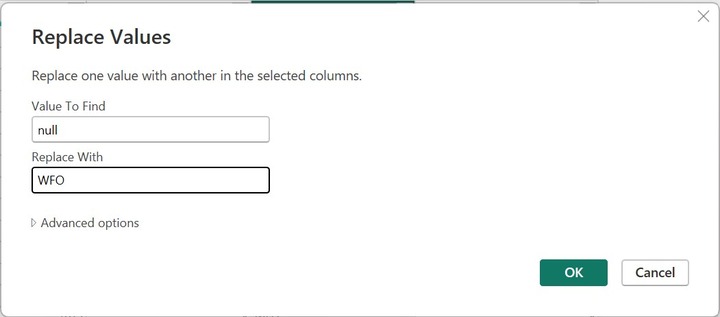
For instance, if you want to replace the null values with WFO. Navigate to the "Transform" tab select the "Replace Values" and click on the "Replace Error".
Enter "null" in the Value to Find" textbox and write "WFO" in the "Replace With" textbox and click on the OK.
Therefore, all field values that contain null are replaced with the "WFO". Similarly, we can replace the error values of the specified column with the correct values.
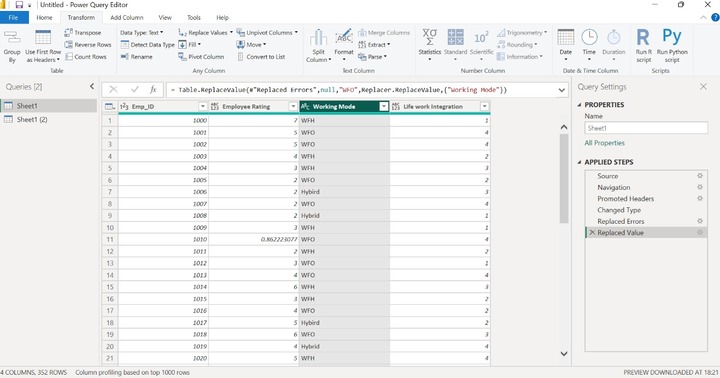
Moreover, you can replace the duplicate values with another new data value and unlimited data manipulation can be done in the Power Query Editor. To perform DAX expressions, you can edit the existing dataset and add a new column to compute the complicated DAX expressions. A duplicate column is also created that contains the same data value as the selected column. An index column can be created where numbers are either started from 0 or 1.