- Power BI - Home
- Power BI - Introduction
- Power BI - Installation Steps
- Power BI - Architecture
- Power BI Desktop
- Power BI - Desktop
- Power BI - Desktop Window
- Power BI Service
- Power BI - Window Supported Browsers
- Power BI - Generating Reports
- Power BI Desktop Service
- Power BI - Desktop vs Service
- Power BI - Supported Data Sources
- Power BI - Comparison Tools
- Power Query Editor
- Power Query Editor - Introduction
- Power Query Editor - Data Discrepancy
- Power Query Editor - Merge Queries (Part 1)
- Power Query Editor - Merge Queries (Part 2)
- Power BI - Develop Star Schema
- Data Modeling Concepts
- Power BI - Data Modeling
- Power BI - Manage Relationships
- Power BI - Cardinality
- Power BI - Dashboard Options
- Power BI Report Visualizations
- Power BI - Visualization Options
- Power BI - Visualization Charts
- Power BI - Stacked Bar Chart
- Power BI - Stacked Column Chart
- Power BI - Clustered Chart
- Power BI - 100% Stacked Chart
- Power BI - Area Chart and Stacked Area Chart
- Power BI - Line and Stacked Column Chart
- Power BI - Line and Clustered Column Chart
- Power BI - Ribbon Chart
- Power BI - Table and Matrix Visuals
- Power BI Map Visualizations
- Power BI - Creating Map Visualizations
- Power BI - ArcGIS Map
- Power BI Miscellaneous
- Power BI - Waterfall Charts
- Funnel Charts and Radial Gauge Chart
- Power BI - Scatter Chart
- Power BI - Pie Chart and Donut Chart
- Power BI - Card and Slicer Visualization
- Power BI - KPI Visual
- Power BI - Smart Narrative Visual
- Power BI - Decomposition Tree
- Power BI - Paginated Report
- Power BI - Python Script & R Script
- Power BI - Multi-row Card
- Power BI - Power Apps & Power Automate
- Power BI - Excel Integration
- Power BI Dashboard
- Power BI - Sharing Dashboards
- Power BI Sales Production Dashboard
- Power BI - HR Analytics Dashboard
- Power BI - Customer Analytics Dashborad
- Power BI - DAX Basics
- Power BI - Administration Role
- Power BI - DAX Functions
- Power BI - DAX Text Functions
- Power BI - DAX Date Functions
- Power BI - DAX Logical Functions
- Power BI - DAX Counting Functions
- Power BI - Depreciation Functions
- Power BI - DAX Information Functions
Power BI - Desktop Window
The Power BI desktop interface is a fundamental part of storytelling. It is quite resembled to MS Office. You may add ingredients to your reports to create eye-catching dashboards and reports. The different interfaces of the Power BI desktop window −
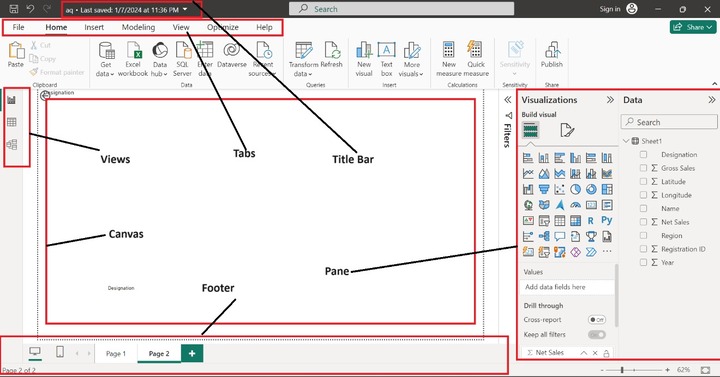
The title bar at the top shows the name of the current file. The distinct tabs like File, Home, Insert, Modeling and so on will be discussed in the next part. The three icons on the middle-left side of the window show the various types of views. The middle glass shows the canvas. The right side of the window shows the different panes, like the Visualization pane and the data pane. The bottom part of the window indicates the footer.
Types of Tabs
Here are the key types of tabs you will encounter in Power BI −
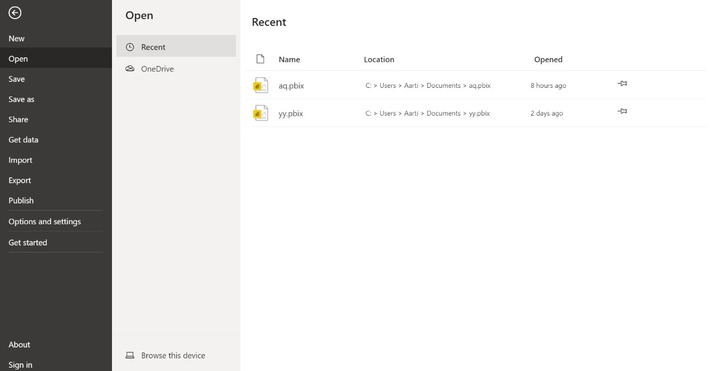
File Tab
You may open new or old files and get data from the specified location. Also, import the files from the system or export the existing files to pdf. Furthermore, you can alter the data source settings by using the "Option and setting" and broadcast and share their reports by selecting the "Publish" option.
Home Tab
The description of its various groups is as follows −
- Clipboard − It permits you to cut, copy, and paste the visual to another location.
- Data − It allows you to import data from multiple sources. You may import the Excel workbook by choosing the "Excel Workbook" option instantly. Data hubs are seamlessly used in Power BI service. You may develop the live connection to semantic models, data marts, Warehouses, and Lakehouse and use authentic data in the Power BI service.
- Queries − It uses a Power Query editor that acts as a backend. You may rectify the data anomalies and connect and cleanse the data by choosing the "Transform data" option.
- Insert − You can add new ingredients to the report by utilizing the "Insert" group that can add new visuals, and textbox and import custom visuals directly either from the Appstore or the local system.
- Calculations − New measure" where DAX expressions are written and use "Quick measure" to develop complicated calculations.
- Sensitivity −
- Share − You may broadcast the report in the Power BI service.

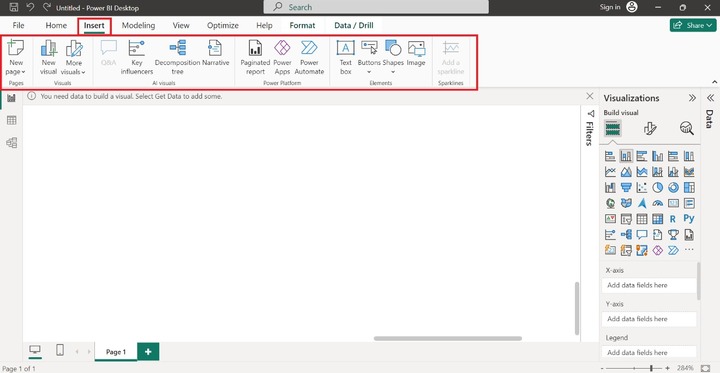
Insert Tab
The extensive information related to the Insert tab's groups is as follows −
- Pages − You can add new pages either blank or duplicate pages into the report by using the Pages group.
- Visuals − You may utilize the Visuals group to add new visuals or more visuals from appsource or my files to the report to make interactive reports.
- AI visuals − Natural languages are used by AI visual groups, and metric influencers are added to the report by choosing key influences, a decomposition tree indicates how data is represented hierarchically, and narrative generates intelligent summaries of data automatically.
- Power Platform − This group is used to integrate paginated reports, Power Automate to automate complex tasks and Power apps.
- Elements − You can add distinct elements like Text boxes, Buttons, Shapes, and Images to the report.
- Sparklines − You can embed a sparkline (small chart) in either a matrix or table visuals.
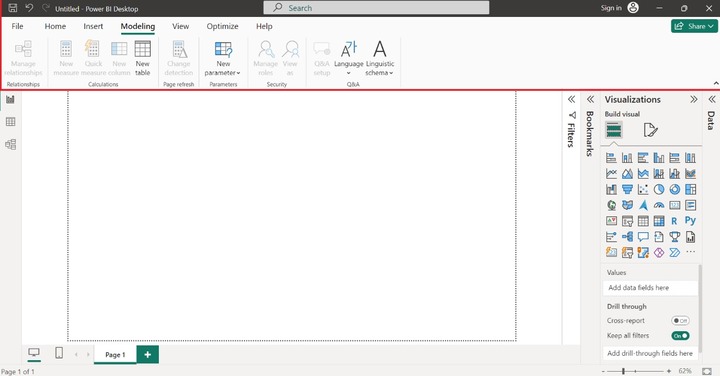
Modeling Tab
The description of various groups residing in Modeling tab is described below −
- Relationships − You may choose the "Manage relationships" option if you wish to append, alter, or delete relationships among tables.
- Calculations − You can employ DAX expressions to generate new tables and new columns, and new measures can be developed through this calculation group.
- Page Refresh − It permits you to refresh pages relying on identifying changes in the dataset to enhance the performance of the report.
- Parameters − We may add parameters to the visuals and also use slicers to adjust the inputs and predict the output.
- Security − Managers and higher-level authority use the "Security" option to ensure the row level of security.
- Q&A − You may use this group to understand the dataset and alter the language utilized to ask questions to know more about terms and data.
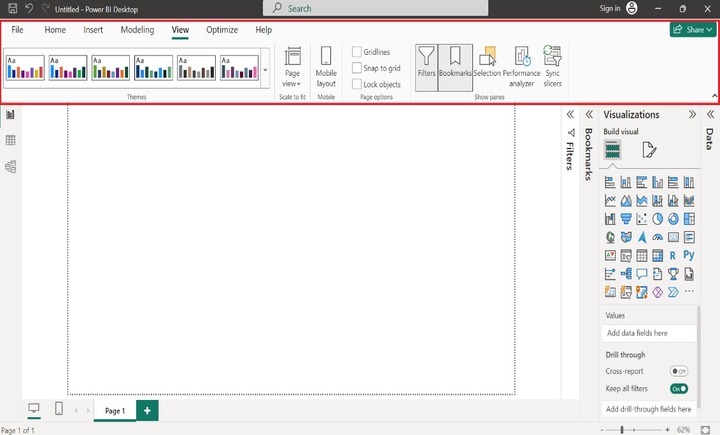
View Tab
The description of its various groups is written below −
- Themes − You can create a theme, change the default theme of the report, and customize the present theme for stunning reports.
- Scale to fit − Depending on your needs, you can choose from alternatives like "fit to width," "fit to page," and "actual size" of the page.
- Mobile − You may also create a report for mobile phones.
- Page options − You can automatically or manually align the objects either by selecting the "Snap to grid" option or "Gridline" option and also lock objects while showcasing the presentation.
- Show Panes − The filter pane can either be visible or hidden by using the filter option. Bookmarks can be added or viewed to capture the data.
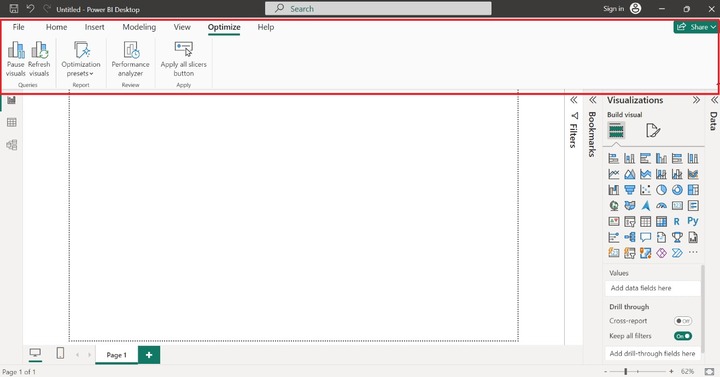
Optimize Tab
The following are different groups in the Optimize tab −
- Queries − This group permits you to stop or resume visuals during changes in the report.
- Report − You may optimize the report settings to enhance the performance of the report for better interaction and to minimize queries.
- Review − You inspect the report performance and enhance the areas that require further improvement.
- Apply − You may add an "Apply all slicers button" in the report if there are multiple slicers on a page and this control will apply to all slicers.
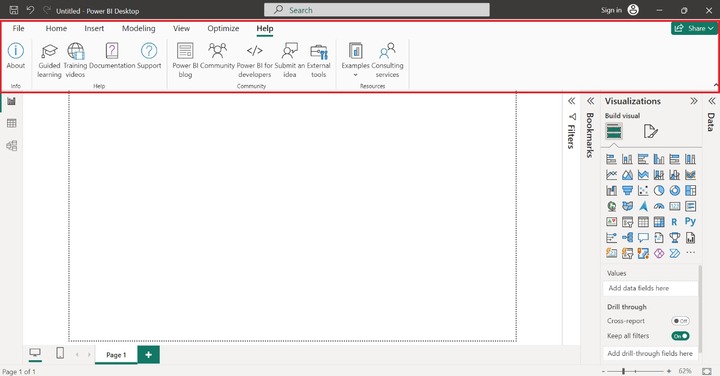
Help Tab
Each tab has a different group, and the following are the groups in the Help tab −
- Info − This group assists users in knowing the version of downloaded Power BI tools and acquiring the session information while submitting a ticket.
- Help − You may take help from the training videos, support, and documentation to learn more about Power BI.
- Community − You may join the Power BI community to collaborate with other experts and read the blog, get to know the recent updates of the tools, and also download the external tools that are compatible with Power BI.
- Resources − You may explore examples and workshops provided by the consulting service to enhance your skills.