- Power BI - Home
- Power BI - Introduction
- Power BI - Installation Steps
- Power BI - Architecture
- Power BI Desktop
- Power BI - Desktop
- Power BI - Desktop Window
- Power BI Service
- Power BI - Window Supported Browsers
- Power BI - Generating Reports
- Power BI Desktop Service
- Power BI - Desktop vs Service
- Power BI - Supported Data Sources
- Power BI - Comparison Tools
- Power Query Editor
- Power Query Editor - Introduction
- Power Query Editor - Data Discrepancy
- Power Query Editor - Merge Queries (Part 1)
- Power Query Editor - Merge Queries (Part 2)
- Power BI - Develop Star Schema
- Data Modeling Concepts
- Power BI - Data Modeling
- Power BI - Manage Relationships
- Power BI - Cardinality
- Power BI - Dashboard Options
- Power BI Report Visualizations
- Power BI - Visualization Options
- Power BI - Visualization Charts
- Power BI - Stacked Bar Chart
- Power BI - Stacked Column Chart
- Power BI - Clustered Chart
- Power BI - 100% Stacked Chart
- Power BI - Area Chart and Stacked Area Chart
- Power BI - Line and Stacked Column Chart
- Power BI - Line and Clustered Column Chart
- Power BI - Ribbon Chart
- Power BI - Table and Matrix Visuals
- Power BI Map Visualizations
- Power BI - Creating Map Visualizations
- Power BI - ArcGIS Map
- Power BI Miscellaneous
- Power BI - Waterfall Charts
- Funnel Charts and Radial Gauge Chart
- Power BI - Scatter Chart
- Power BI - Pie Chart and Donut Chart
- Power BI - Card and Slicer Visualization
- Power BI - KPI Visual
- Power BI - Smart Narrative Visual
- Power BI - Decomposition Tree
- Power BI - Paginated Report
- Power BI - Python Script & R Script
- Power BI - Multi-row Card
- Power BI - Power Apps & Power Automate
- Power BI - Excel Integration
- Power BI Dashboard
- Power BI - Sharing Dashboards
- Power BI Sales Production Dashboard
- Power BI - HR Analytics Dashboard
- Power BI - Customer Analytics Dashborad
- Power BI - DAX Basics
- Power BI - Administration Role
- Power BI - DAX Functions
- Power BI - DAX Text Functions
- Power BI - DAX Date Functions
- Power BI - DAX Logical Functions
- Power BI - DAX Counting Functions
- Power BI - Depreciation Functions
- Power BI - DAX Information Functions
Power BI - Dashboards Options
In this chapter, you will learn about the various dashboard options available in Power BI.
Exploring Different Datasets
Power BI tool provides a lot of options to explore the datasets. When you are working on your BI report or dashboards, you can use Power BI to look for quick insights. Navigate to the datasets section on the left side of the tool UI, click the 3 dots (...), and click Get Insights.
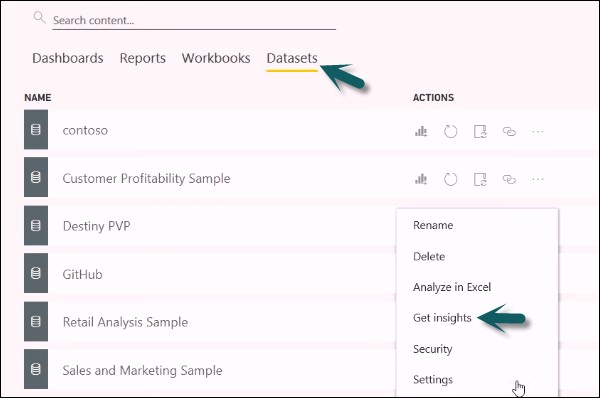
When you select the Get Insights option, it runs all the algorithms in your dataset and once it is complete, you get a notification that insight is ready for your dataset.

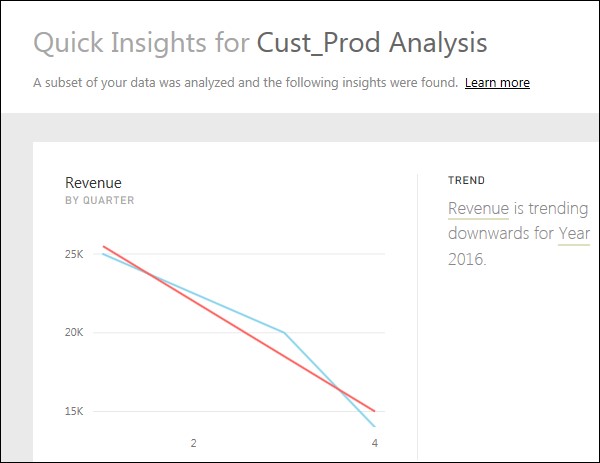
You can click the View Insights option and the tool will show you all chart representations of your data insights. You can any time go to this option and check the insights option in your dataset.
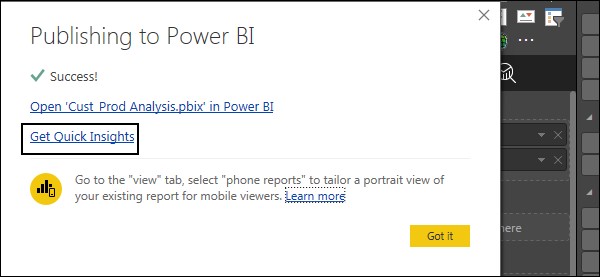
When you publish a report to Power BI service, you also get an option of Quick Insight on the first page.
Creating Dashboards
In Power BI, you can create a dashboard by pinning visualizations from BI reports that are published using Power BI desktop. All the visualizations that are created using Power BI service are also available for pinning to create dashboards.
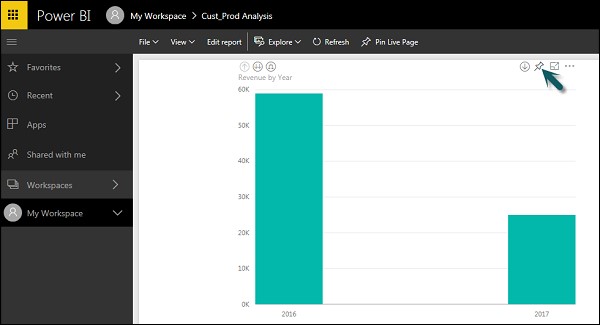
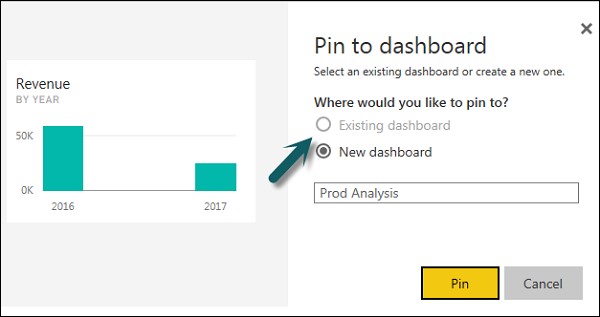
In Power BI, if you want to pin a visual, open the BI report on the Power BI service. At the top of the visual, select the pin icon.
When you use the Pin option, as shown in the above screenshot, a new dialog box appears as shown in the following screenshot. It asks you to create a new dashboard or select an existing dashboard to put the visual from the dropdown list. If you don't have an existing dashboard, then this option is greyed out.
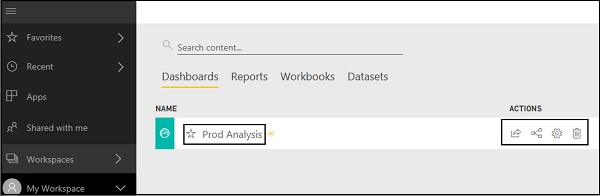
Once you click the Pin button, you will get a confirmation that your visualization is "Pinned" to the dashboard. You can click My Workspace and check the dashboard.
Once your dashboard is created, you can use different options to configure the dashboard.
Tiles in Dashboard
When you check More Options in the dashboard, you can see an option of Focus Mode and other different options in the dashboard.
Focus Mode is used to take a closer look at your dashboard data. When you have multiple values in the dashboard, you can use the Focus Mode for a better view of the objects in the dashboard. If there are any columns, that are not shown due to space issues, you can also view those using the Focus Mode.
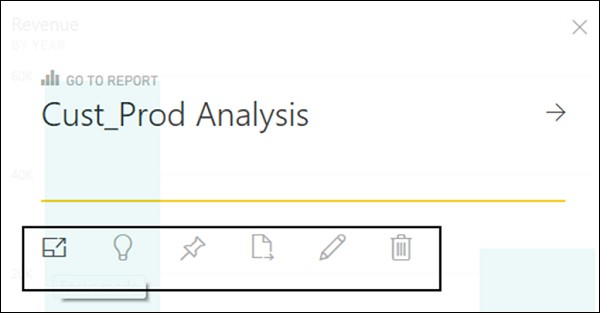
Focus Mode is used to see all the data in the dashboard/report. It is also possible to pin the visual directly from Focus Mode to a different dashboard by selecting the Pin icon.
To exit the Focus Mode, you can select the Exit Focus Mode option.

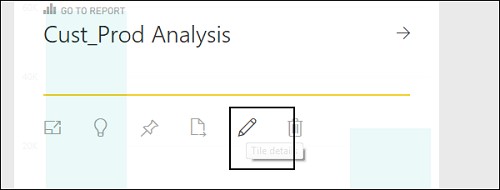
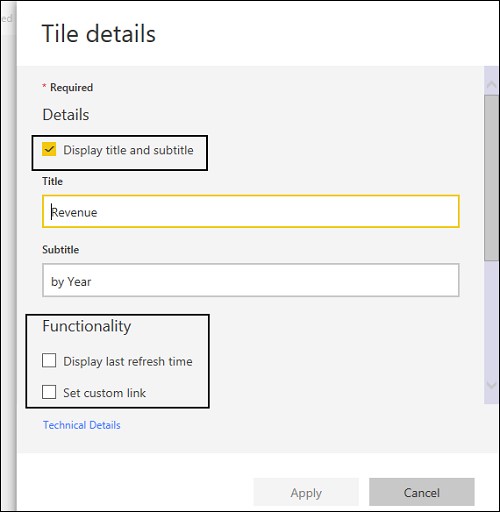
You can also use the Tile Details option to edit few formatting changes. This option allows to change the tile's title, subtitle, last refresh time and date, and other details, such as creating a custom link for your dashboard.
Data Gateway
You can connect on-premise data sources to Power BI service using a data gateway. You can also use a version of the data gateway that doesn't include any administration configuration and it is called a Personal Gateway.
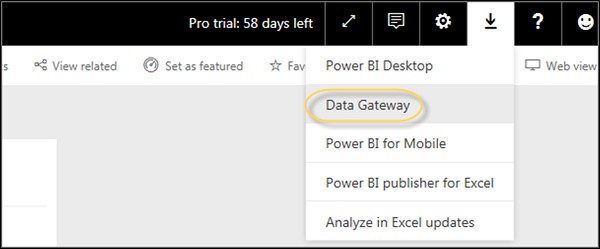
You can set up Personal Gateway by logging into the Power BI service. You have to select the download icon on the top right-hand corner of the screen and click Data Gateway.
As per Power BI official site, using Data Gateway with the on-premises gateways, you can keep your data fresh by connecting to your on-premises data sources without the need to move the data. Query large datasets and benefit from your existing investments. The gateways provide the flexibility you need to meet individual needs and the needs of your organization.
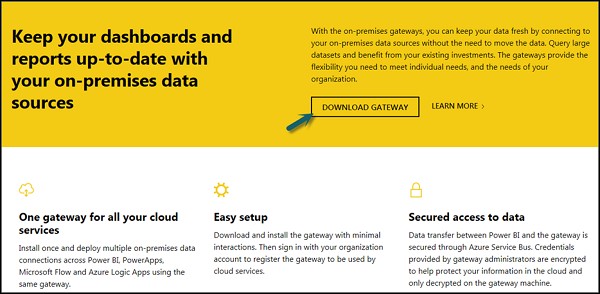
To set up download gateways, you have to run the setup till it is downloaded and the installation wizard is complete.
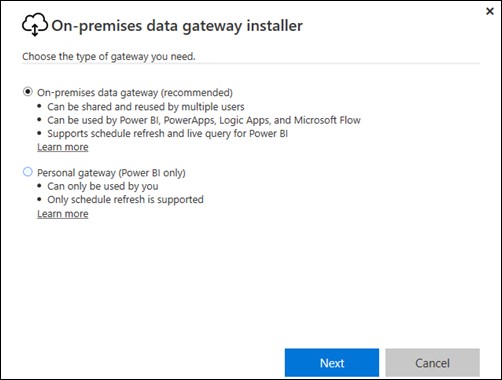
You have an option to select either −
- On-premise data gateway or
- Personal gateway (Power BI only)
Once you launch Power BI Gateway, you have to log in to the Power BI gateway service.
You can also enable automatic updates by navigating to Schedule Refresh and the frequency of the schedule.