- Power BI - Home
- Power BI - Introduction
- Power BI - Installation Steps
- Power BI - Architecture
- Power BI Desktop
- Power BI - Desktop
- Power BI - Desktop Window
- Power BI Service
- Power BI - Window Supported Browsers
- Power BI - Generating Reports
- Power BI Desktop Service
- Power BI - Desktop vs Service
- Power BI - Supported Data Sources
- Power BI - Comparison Tools
- Power Query Editor
- Power Query Editor - Introduction
- Power Query Editor - Data Discrepancy
- Power Query Editor - Merge Queries (Part 1)
- Power Query Editor - Merge Queries (Part 2)
- Power BI - Develop Star Schema
- Data Modeling Concepts
- Power BI - Data Modeling
- Power BI - Manage Relationships
- Power BI - Cardinality
- Power BI - Dashboard Options
- Power BI Report Visualizations
- Power BI - Visualization Options
- Power BI - Visualization Charts
- Power BI - Stacked Bar Chart
- Power BI - Stacked Column Chart
- Power BI - Clustered Chart
- Power BI - 100% Stacked Chart
- Power BI - Area Chart and Stacked Area Chart
- Power BI - Line and Stacked Column Chart
- Power BI - Line and Clustered Column Chart
- Power BI - Ribbon Chart
- Power BI - Table and Matrix Visuals
- Power BI Map Visualizations
- Power BI - Creating Map Visualizations
- Power BI - ArcGIS Map
- Power BI Miscellaneous
- Power BI - Waterfall Charts
- Funnel Charts and Radial Gauge Chart
- Power BI - Scatter Chart
- Power BI - Pie Chart and Donut Chart
- Power BI - Card and Slicer Visualization
- Power BI - KPI Visual
- Power BI - Smart Narrative Visual
- Power BI - Decomposition Tree
- Power BI - Paginated Report
- Power BI - Python Script & R Script
- Power BI - Multi-row Card
- Power BI - Power Apps & Power Automate
- Power BI - Excel Integration
- Power BI Dashboard
- Power BI - Sharing Dashboards
- Power BI Sales Production Dashboard
- Power BI - HR Analytics Dashboard
- Power BI - Customer Analytics Dashborad
- Power BI - DAX Basics
- Power BI - Administration Role
- Power BI - DAX Functions
- Power BI - DAX Text Functions
- Power BI - DAX Date Functions
- Power BI - DAX Logical Functions
- Power BI - DAX Counting Functions
- Power BI - Depreciation Functions
- Power BI - DAX Information Functions
Power BI - Window Supported Browsers
Getting Started with Power BI Service
Open the website app.powerbi.com and log in through an official email ID to open the Power BI service component where you can develop the reports, dashboards, apps, and workspace to share your stories with others. As you can observe in the screenshot, multiple tabs are available on the left pane of the Power BI service window.
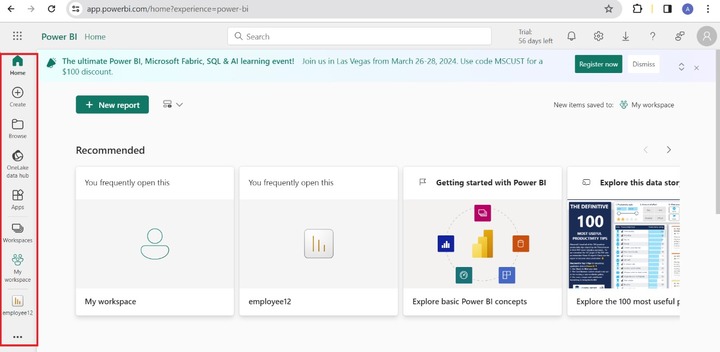
Home Tab
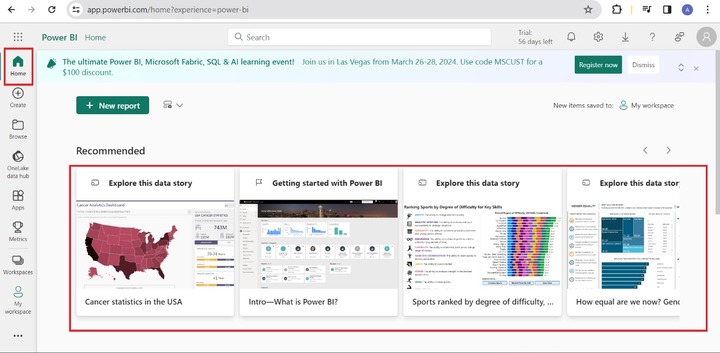
Once you click on the Home tab, the Recommended section displays the frequently opened reports, and it would help you to examine the various data stories to gain important facts about them.
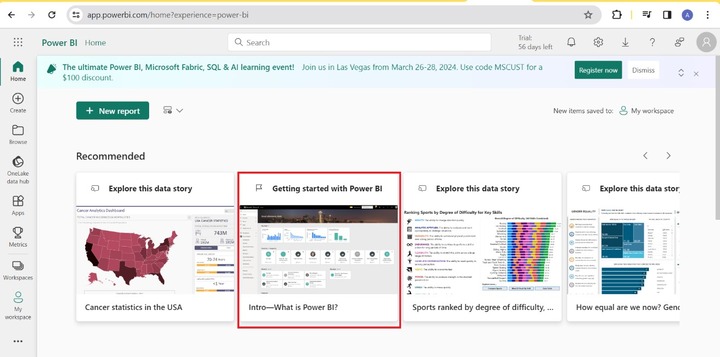
Suppose you are not familiar with Power BI, then you can master Power BI skills by clicking on "Getting started with Power BI" which redirects the page to the Microsoft official Power BI documentation website.
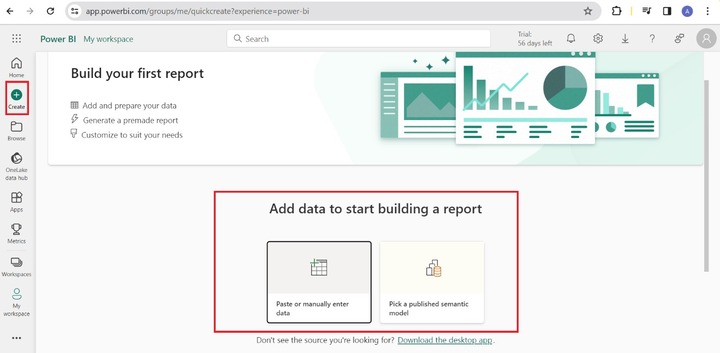
Create Tab
You may click on the "Create" tab where you can enter the data manually or copy and paste the data. Two options "Paste or manually enter data" and "Pick a published semantic model" are available to build the interactive reports.
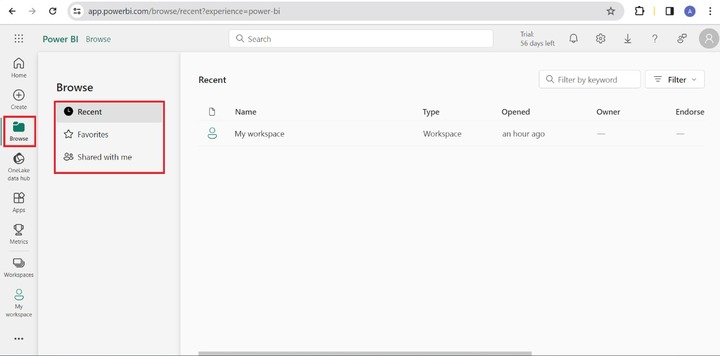
Browse Tab
You may browse the recently opened files and the files that are shared with you.
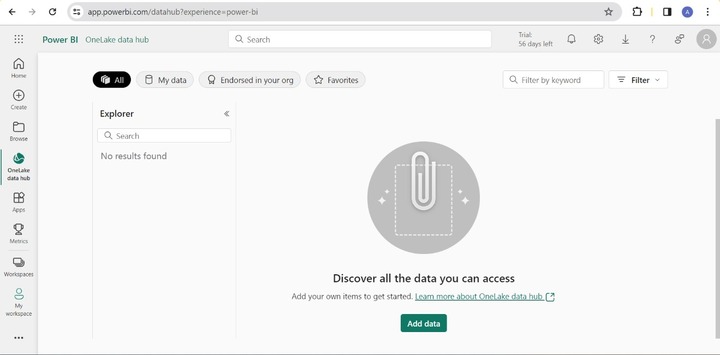
OneLake Data Hub
"OneLake data hub" is the place where you can search data and gain access to all recommended items and explore the endorsed data items in your organization. You may search for items in the workspaces. You may add data to build the report by choosing "My Data".
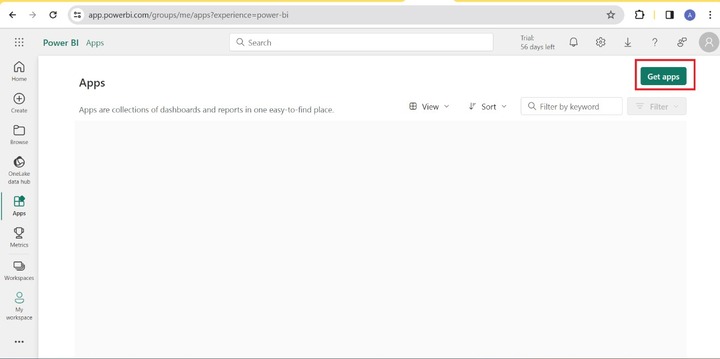
Apps
Apps comprise dashboards and reports. You may also download Power Apps that provide intelligent insights and explore business-driven data. You may select "Get apps" to install Apps.
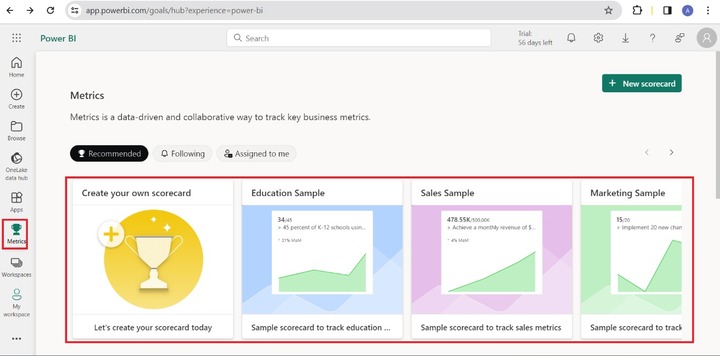
Metrics
You may create a new scorecard and employ it to monitor organizational metrics like education metrics, and sales and marketing metrics.
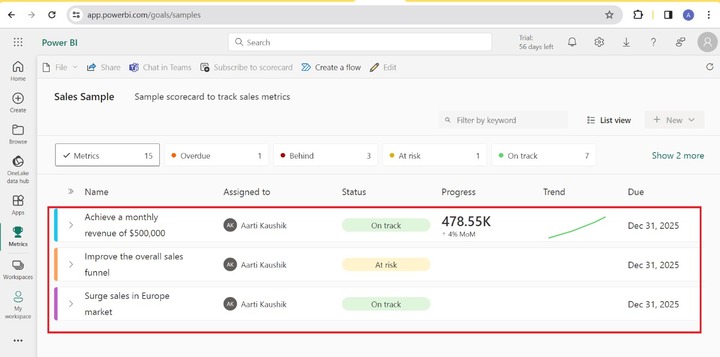
For example, you can select the Sales Sample where you can monitor the 15 metrics and observe the status of every metric.
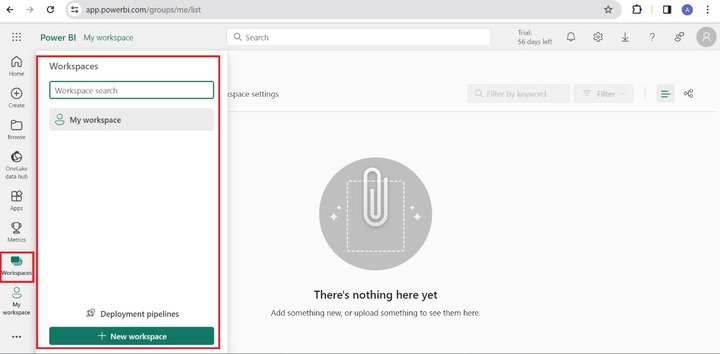
Workspaces
You may explore the workspaces and create a new workspace under the Workspace tab. Click on the "New workspace" to build a new workspace.
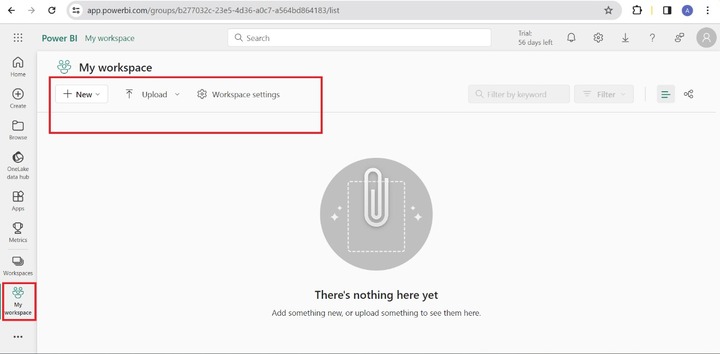
My Workspace
You may choose "My workspace" to create stunning reports, dashboards, paginated reports, scorecards, semantic models, and streaming datasets. You can also upload the .pbix or .rdl file to your workspace.
You can click on "Workspace Settings" specify the non-duplicate name of the workspace and upload the image for the created workspace. You may also configure the setting for Azure connections and OneLake in the workspace. The premium license is mandatory for Git integration. Use the "Other" option to remove the workspace.
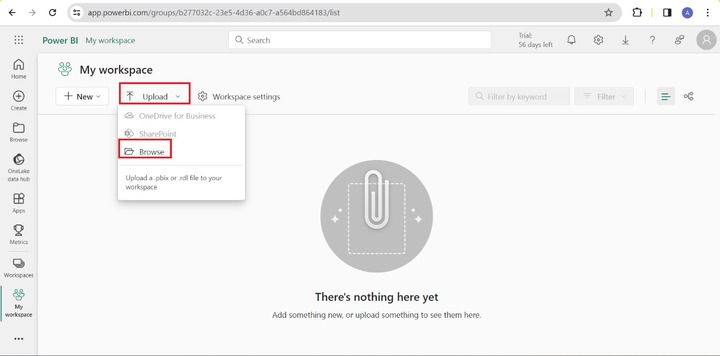
Example
Suppose you wish to upload the .pbix file. Expand the "Upload" tile and click on the "Browse". Choose the specified file with the .pbix extension. Once the file are uploaded will show in the My workspace tab.
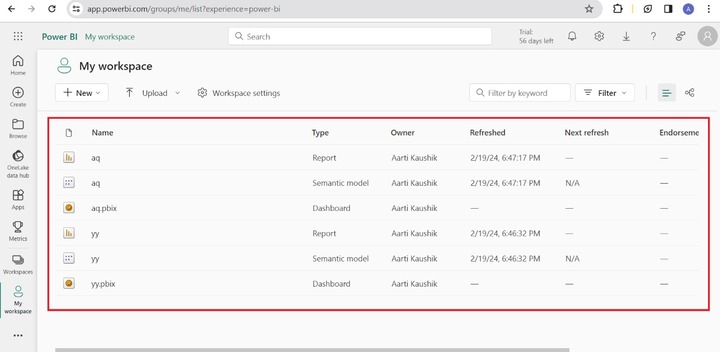
Here you can observe in the screenshot, the two types of files are created for every .pbix file. Lets click on the "yy" report.
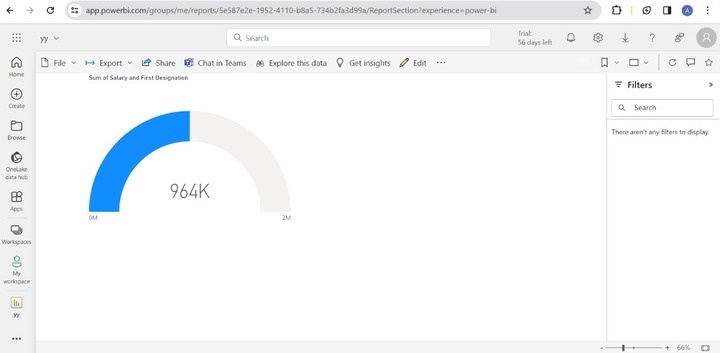
The screenshot shows the report of the "yy" file. Similarly, you can open other uploaded files and also view the semantic model of these files.
You may find more tabs like "Monitoring hub", "Deployment pipelines", and "Learn" if you click on the three dots.
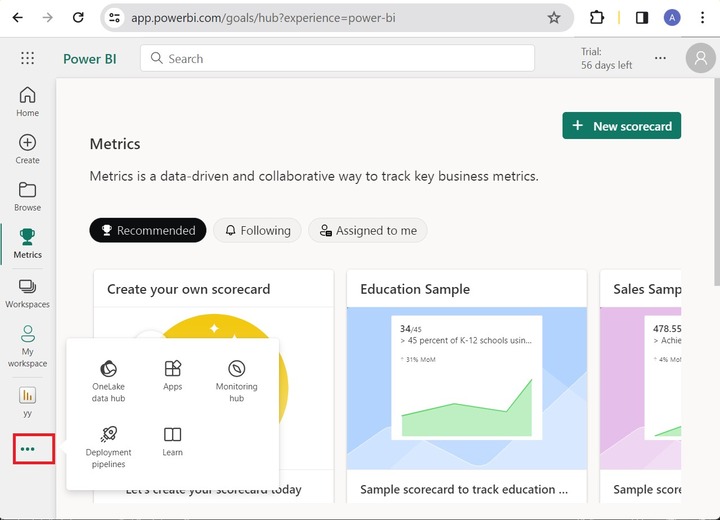
Monitoring Hub
You can investigate and keep an eye on the status of all the actions throughout every workspace that you are authorized to perform.
Deployment Pipelines
It allows users to manage and validate the workspace content before sharing with others.
The following are the four phases to deploy pipelines −
- Develop a pipeline.
- Choose the workspace and assign it further to the development and testing team.
- Review and test the content before sharing it with users.
- Share the latest content to users.
Learn
It is a learning hub for Power BI aspirants, you may inculcate valuable knowledge through reading Power BI documents, joining the Power BI community, registering yourself in upcoming webinars, and checking out the latest updates of the Power BI.
Supported Browsers in Power BI
The supported browsers are −
- Microsoft Edge
- Safari Mac
- Firefox
- Google Chrome
It would be suggested to use the latest version of these browsers for best performance. Internet Explorer shows poor performance as it is not promoted by Power BI.
Supported Language in Power BI
When you configure the Power BI desktop, it will support only 42 languages. You may the set language during the time of Power BI installation.
How to Set Model Language in Power BI Desktop?
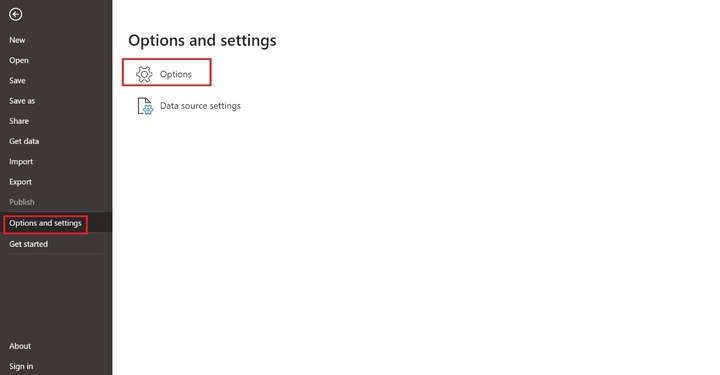
You can select the File tab and choose "Option and settings" and then click on "Options".
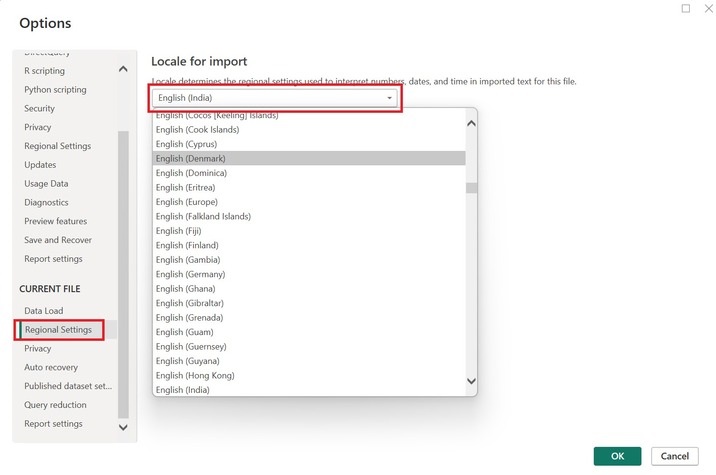
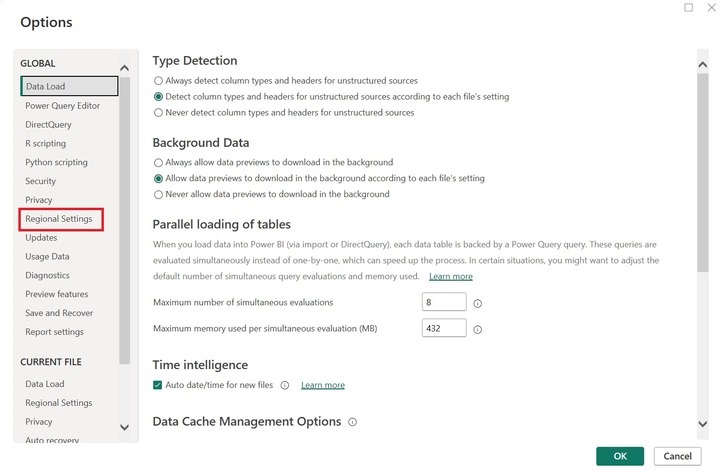
In the Options dialog box, select the "Regional Settings" embedded inside the "GLOBAL" label.
After that choose any of the desired languages from the drop-down menu under "Model language" and click on the OK.
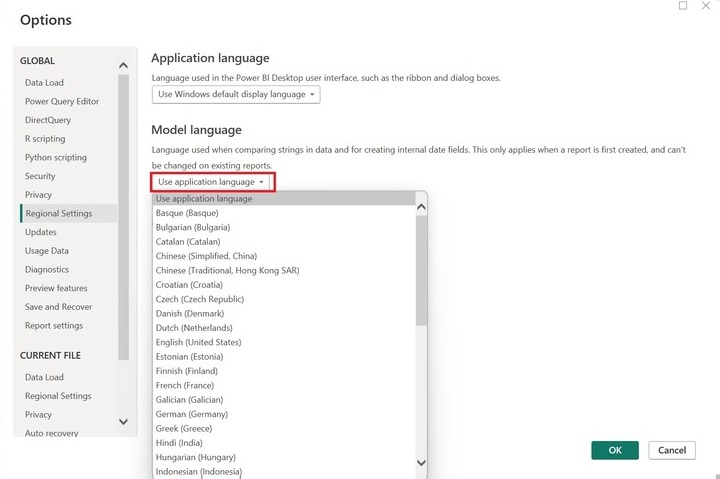
You can also alter the Application language that changes the language of the dialog box, ribbon, and tab in the Power BI desktop.
To change the language of the imported file, you need to select "Regional Settings" from the Current File label and select the required language from the list and click on the OK.