- Power BI - Home
- Power BI - Introduction
- Power BI - Installation Steps
- Power BI - Architecture
- Power BI Desktop
- Power BI - Desktop
- Power BI - Desktop Window
- Power BI Service
- Power BI - Window Supported Browsers
- Power BI - Generating Reports
- Power BI Desktop Service
- Power BI - Desktop vs Service
- Power BI - Supported Data Sources
- Power BI - Comparison Tools
- Power Query Editor
- Power Query Editor - Introduction
- Power Query Editor - Data Discrepancy
- Power Query Editor - Merge Queries (Part 1)
- Power Query Editor - Merge Queries (Part 2)
- Power BI - Develop Star Schema
- Data Modeling Concepts
- Power BI - Data Modeling
- Power BI - Manage Relationships
- Power BI - Cardinality
- Power BI - Dashboard Options
- Power BI Report Visualizations
- Power BI - Visualization Options
- Power BI - Visualization Charts
- Power BI - Stacked Bar Chart
- Power BI - Stacked Column Chart
- Power BI - Clustered Chart
- Power BI - 100% Stacked Chart
- Power BI - Area Chart and Stacked Area Chart
- Power BI - Line and Stacked Column Chart
- Power BI - Line and Clustered Column Chart
- Power BI - Ribbon Chart
- Power BI - Table and Matrix Visuals
- Power BI Map Visualizations
- Power BI - Creating Map Visualizations
- Power BI - ArcGIS Map
- Power BI Miscellaneous
- Power BI - Waterfall Charts
- Funnel Charts and Radial Gauge Chart
- Power BI - Scatter Chart
- Power BI - Pie Chart and Donut Chart
- Power BI - Card and Slicer Visualization
- Power BI - KPI Visual
- Power BI - Smart Narrative Visual
- Power BI - Decomposition Tree
- Power BI - Paginated Report
- Power BI - Python Script & R Script
- Power BI - Multi-row Card
- Power BI - Power Apps & Power Automate
- Power BI - Excel Integration
- Power BI Dashboard
- Power BI - Sharing Dashboards
- Power BI Sales Production Dashboard
- Power BI - HR Analytics Dashboard
- Power BI - Customer Analytics Dashborad
- Power BI - DAX Basics
- Power BI - Administration Role
- Power BI - DAX Functions
- Power BI - DAX Text Functions
- Power BI - DAX Date Functions
- Power BI - DAX Logical Functions
- Power BI - DAX Counting Functions
- Power BI - Depreciation Functions
- Power BI - DAX Information Functions
Power BI - DAX Aggregate Function
In this chapter, DAX Aggregate functions with examples are carried out.
Aggregate Functions that retrieve a single value. The various types of aggregate functions are MIN, MINA, MINX, MAX, MAXA, MAXX, and so on.
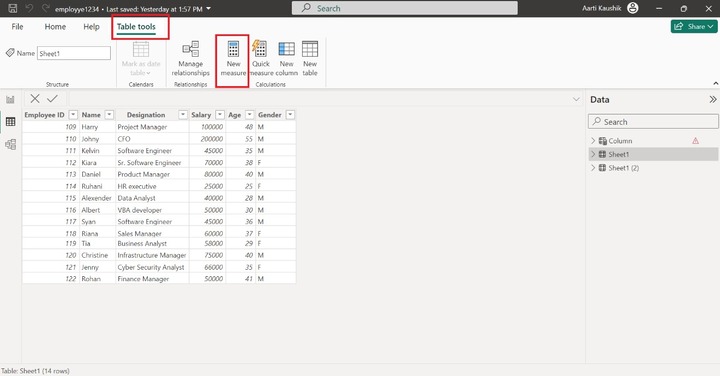
Let's manipulate all these aggregate functions one by one. The various datasets are loaded in this example. You may navigate to the "Table tools" and click on "New measure".
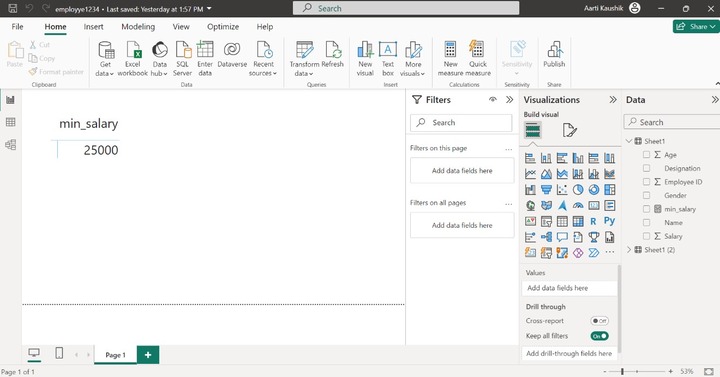
Min Function
Write the expression −
min_salary = min(Sheet1[Salary])
Here, min_salary is the name of a new measure.
Switch to the Report view and select the matrix visual to view the result of the min functions.
MINA Function
It encompasses string and Boolean values also and evaluates the minimum values of the mixed field values in a specified column.
Example − Write the expression in the formula bar −
min_a = MINA(Sheet1[Name])
You can click on the Report view to get the result −

MINX Function
It extracts the smallest text and minimum values that are numeric from a specified column.
min_x = MINX(Sheet1,Sheet1[Name])
Here, min_x is the name of the new measure and Sheet1 specifies the table name and Sheet1[Name] is the column name.
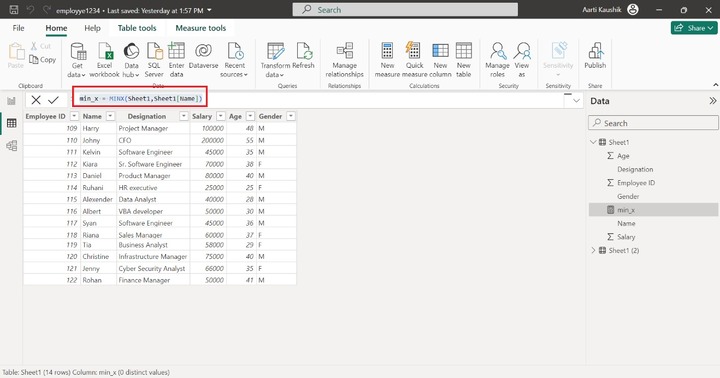
As you can observe in the screenshot, the smallest text value is retrieved from the Name column.

MAX Function
It retrieves the maximum value from the specified column. You may switch to the table view and update the new measure formula.
Write the following expression in the formula bar −
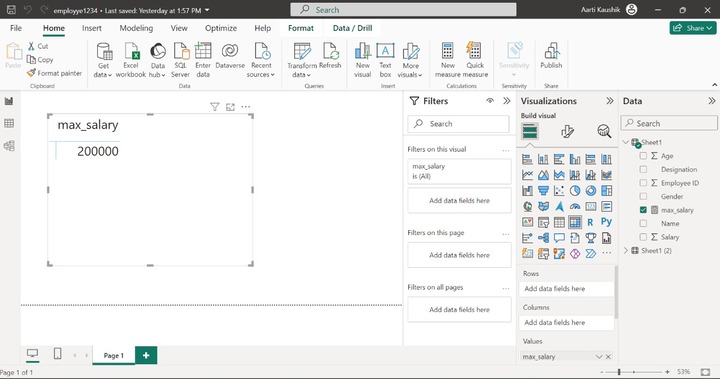
max_salary = MAX(Sheet1[Salary])
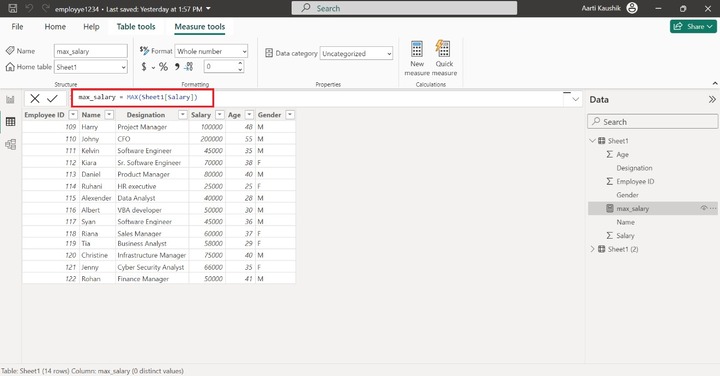
As you can see, the computed result is shown in the screenshot.
MAXA Function
The Boolean values and numeric values are also considered, and it would return the largest field value of a specified field. The null field value is neglected. False entries are assumed as 0, whereas true entries are kept as 1.
Example − Enter the expression −
max_a = MAXA(Sheet1[Age])
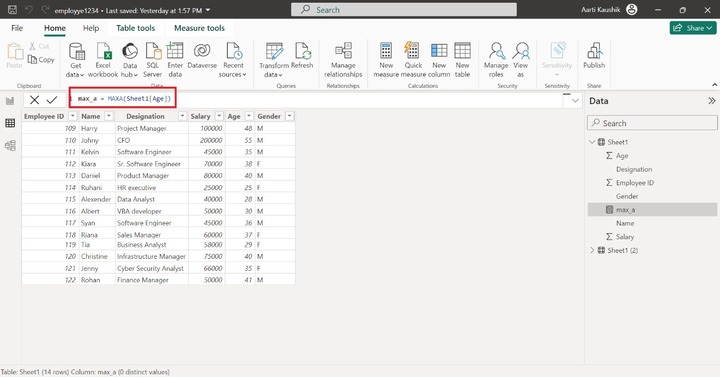
The resulting value is displayed on the canvas.

MAXX Function
This function is applied to Boolean values, dates, strings, and numeric values. It extracts the largest values from a field that contains mixed entries like date, text, and number values.
For instance − Enter the expression in the formula and commit it.
max_x = MAXX(Sheet1, Sheet1[Name])
You can switch to Report View and see the result.

Average Function
It retrieves the arithmetic mean of field values of the specified column. The average function returns 0 if all field values include text in a column. The empty field values are neglected. Rows that include zero will be counted as divisors in the total number of rows.
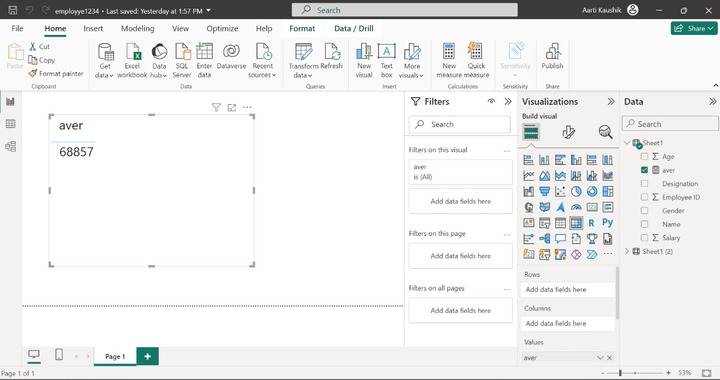
Example: Write the expression in the formula bar −
aver = AVERAGE(Sheet1[Salary])
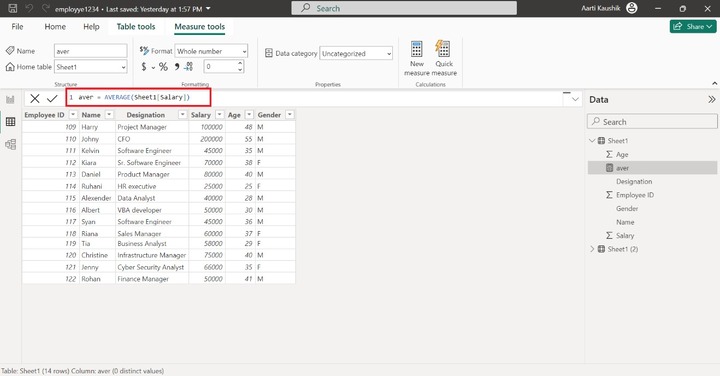
You can navigate to the Report view and observe the result.
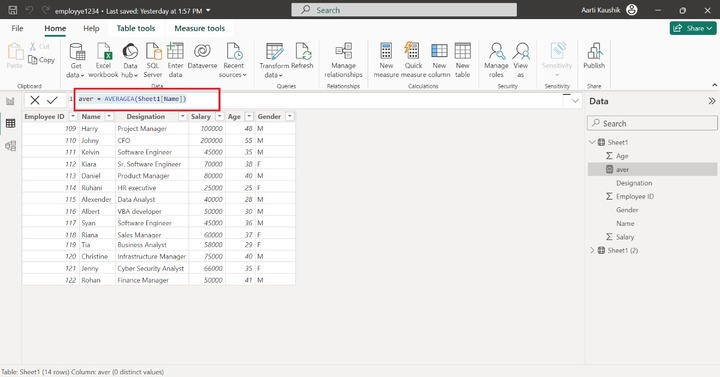
AverageA Function
It calculates the average of the field values in a specified column and encompasses the string and Boolean values.
The following points to be noted −
- The string values like "Name of the employee" and null values will be considered as 0.
- The Boolean values like "False" are assumed as 0 and "True" is assumed as 1.
For example −
aver = AVERAGEA(Sheet1[Name])

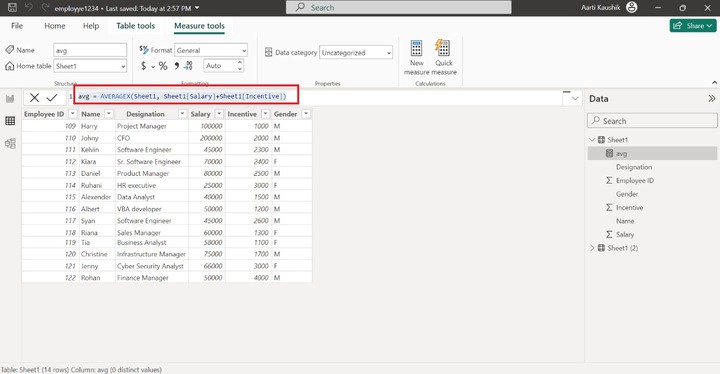
AverageX Function
It computes the arithmetic mean of the defined expression prescribed in the AVERAGEX function.
Example − You can enter the formula −
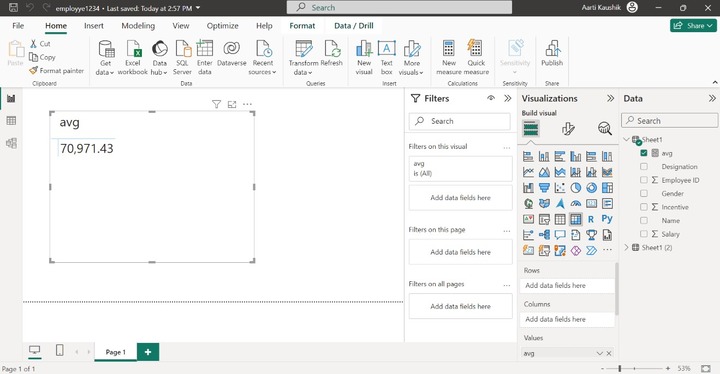
avg = AVERAGEX(Sheet1, Sheet1[Salary]+Sheet1[Incentive])
The computed result will be shown once you click on the Report View.
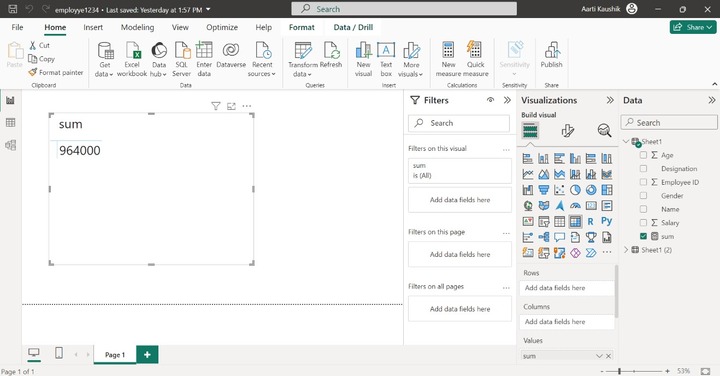
Sum Function
It returns the total addition of all numbers in a designated column.
Example − Enter the following sum formula in the Formula bar −
sum = SUM(Sheet1[Salary])
Furthermore, you can click on the Report View to get the output −
SumX Function
The sumx function comprises two parameters where the first parameter is the table name, and the second parameter specifies the expression. Boolean expressions are prohibited in the SUMX function.
For example − Consider the SumX formula that you have to write in the Formula bar −
sum = SUMX(Sheet1, Sheet1[Salary]-Sheet1[Penality])
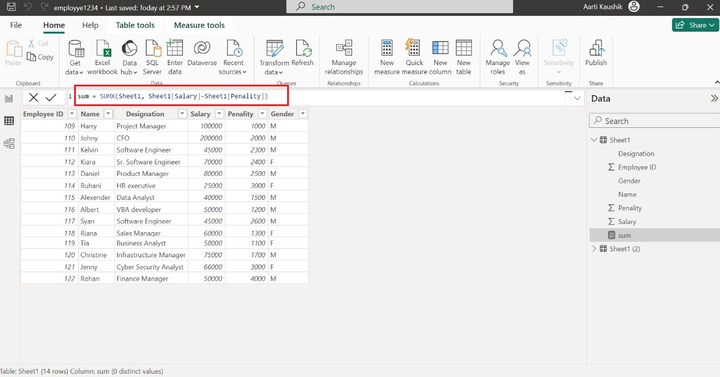
You may verify the result after switching to the Report View.

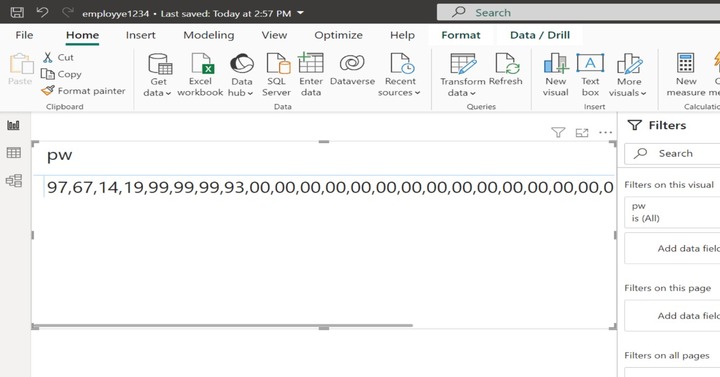
PRODUCT Function
It evaluates the multiplication of the numbers designated in a specified column.
Example: Assume the following expression −
pw = PRODUCT(Sheet1[Incentive])
Here, pw is the name of the new measure and Sheet1[Incentive] is the column name.
Now, you can switch to the Report View to get the result.
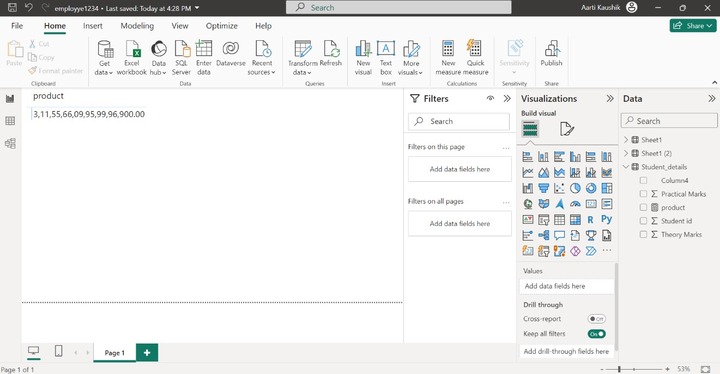
PRODUCTX Function
It returns the product to the given expression defined in the ProductX function. Two parameters will be used in this function. The first parameter indicates the table name and the second parameter represents the expression that will evaluate.
For example − Enter the formula in the formula bar
product =PRODUCTX(Student_details,Student_details[Theory Marks]+Student_details[Practical Marks])
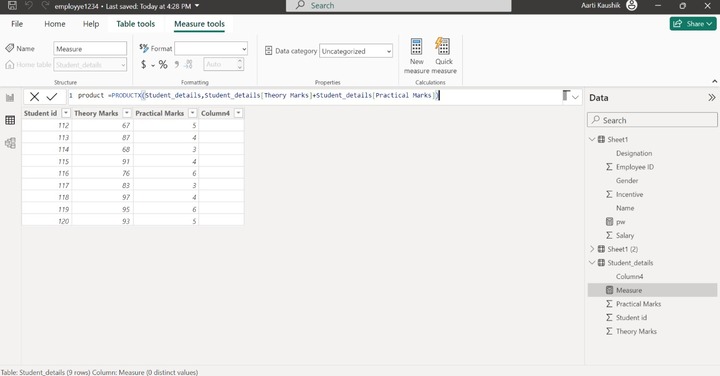
Finally, the computed result is shown in the matrix visual.