- Power BI - Home
- Power BI - Introduction
- Power BI - Installation Steps
- Power BI - Architecture
- Power BI Desktop
- Power BI - Desktop
- Power BI - Desktop Window
- Power BI Service
- Power BI - Window Supported Browsers
- Power BI - Generating Reports
- Power BI Desktop Service
- Power BI - Desktop vs Service
- Power BI - Supported Data Sources
- Power BI - Comparison Tools
- Power Query Editor
- Power Query Editor - Introduction
- Power Query Editor - Data Discrepancy
- Power Query Editor - Merge Queries (Part 1)
- Power Query Editor - Merge Queries (Part 2)
- Power BI - Develop Star Schema
- Data Modeling Concepts
- Power BI - Data Modeling
- Power BI - Manage Relationships
- Power BI - Cardinality
- Power BI - Dashboard Options
- Power BI Report Visualizations
- Power BI - Visualization Options
- Power BI - Visualization Charts
- Power BI - Stacked Bar Chart
- Power BI - Stacked Column Chart
- Power BI - Clustered Chart
- Power BI - 100% Stacked Chart
- Power BI - Area Chart and Stacked Area Chart
- Power BI - Line and Stacked Column Chart
- Power BI - Line and Clustered Column Chart
- Power BI - Ribbon Chart
- Power BI - Table and Matrix Visuals
- Power BI Map Visualizations
- Power BI - Creating Map Visualizations
- Power BI - ArcGIS Map
- Power BI Miscellaneous
- Power BI - Waterfall Charts
- Funnel Charts and Radial Gauge Chart
- Power BI - Scatter Chart
- Power BI - Pie Chart and Donut Chart
- Power BI - Card and Slicer Visualization
- Power BI - KPI Visual
- Power BI - Smart Narrative Visual
- Power BI - Decomposition Tree
- Power BI - Paginated Report
- Power BI - Python Script & R Script
- Power BI - Multi-row Card
- Power BI - Power Apps & Power Automate
- Power BI - Excel Integration
- Power BI Dashboard
- Power BI - Sharing Dashboards
- Power BI Sales Production Dashboard
- Power BI - HR Analytics Dashboard
- Power BI - Customer Analytics Dashborad
- Power BI - DAX Basics
- Power BI - Administration Role
- Power BI - DAX Functions
- Power BI - DAX Text Functions
- Power BI - DAX Date Functions
- Power BI - DAX Logical Functions
- Power BI - DAX Counting Functions
- Power BI - Depreciation Functions
- Power BI - DAX Information Functions
Power BI - Manage Relationships
Once we upload datasets to the BI desktop, this powerful tool automatically detects the relationship between datasets.
Is there a way to modify these default relationships?
Yes, with the aid of the "Manage relationships" option, you may append, alter, or delete the existing relationship.
Handle Relationship in Data Modeling
Following are steps to handle the relationship in Data modeling −
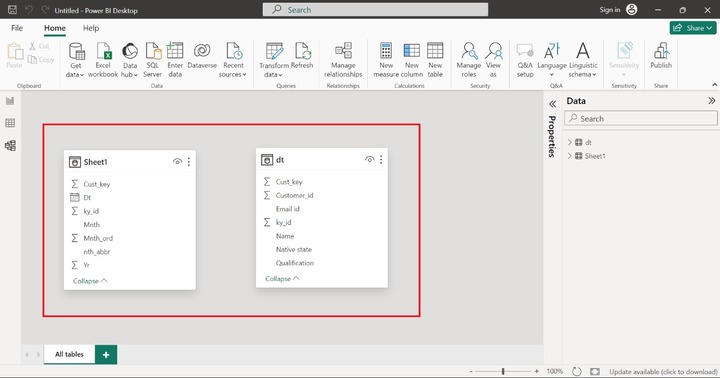
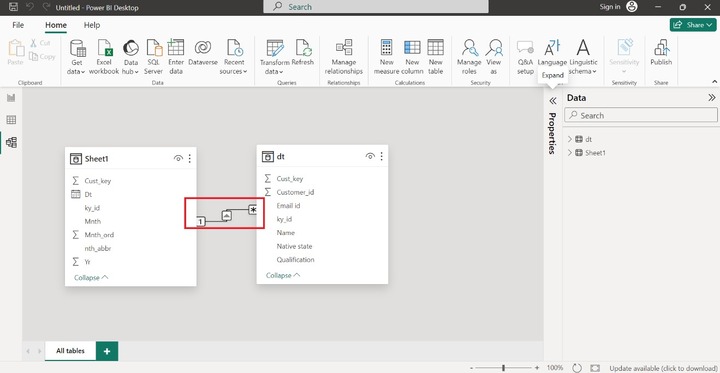
Step 1 − You need to navigate to the "Model View" and click on the "Manage Relationship" under the "Home" tab.
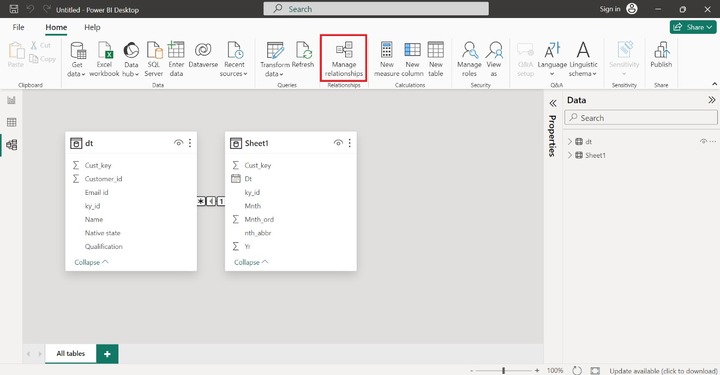
As you can observe in the snapshot, there are many-to-one relationships between "dt" and "Sheet1".
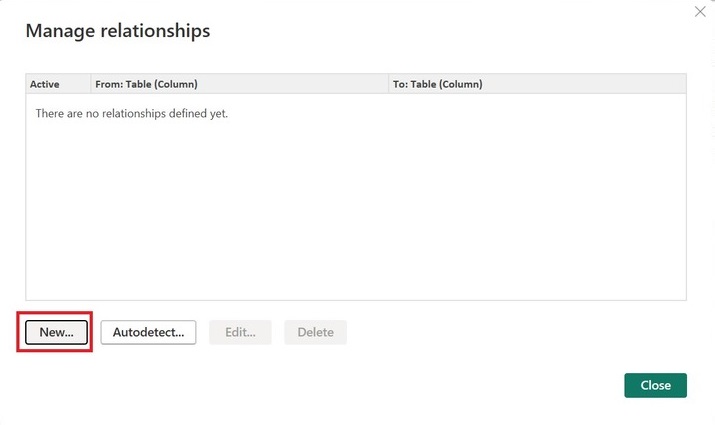
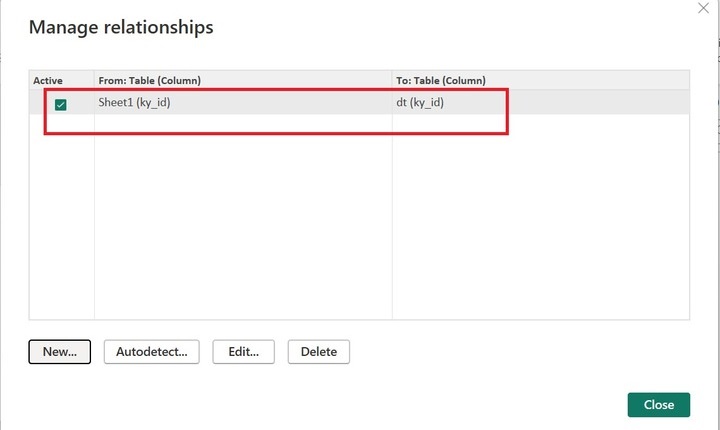
Step 2 − Here is a "Manage relationships" dialog box, where you may add the new relationship, and edit or delete the existing relationship. You may click on the "Delete".
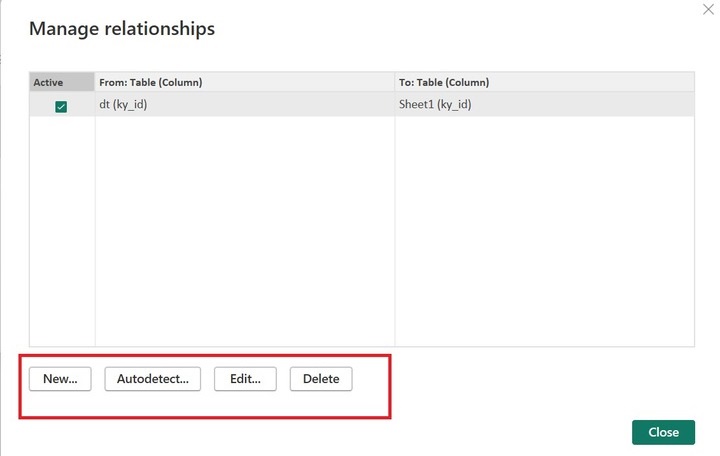
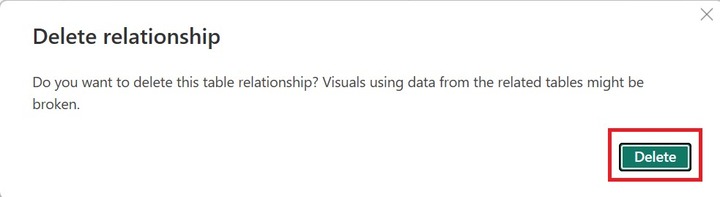
Any window "Delete relationship" pops up where you may click on "Delete".
Step 4 − As you can see in the snapshot, the existing relationship between the tables has been deleted.
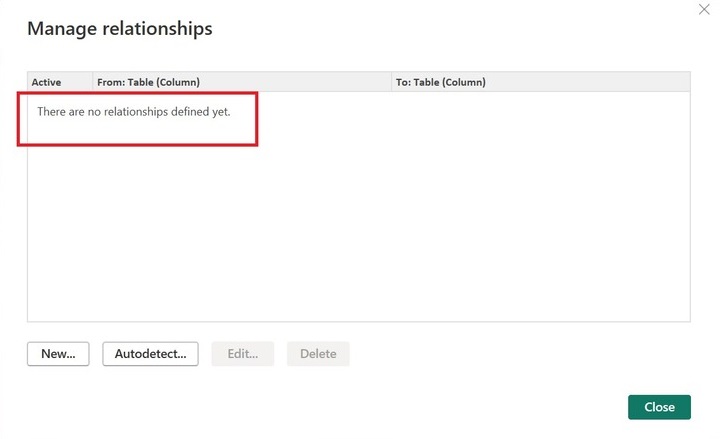
Here, in the Model View, there is no connection between the "Sheet1" and "dt" tables.
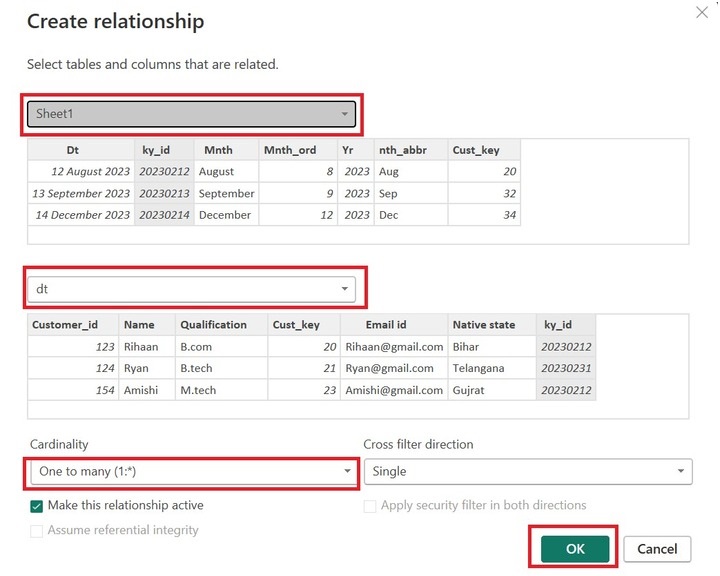
Step 5 − Moreover, you may also click on the "New" tab to create the new relationship.
You may select "Sheet1" as the first table, choose "dt" as the second table, and choose "One to many(1:*)" under "Cardinality" and click on OK.
You may click on the "Close".
Here, you can notice in the snapshot, that one to many relationships between "Sheet1" and "dt" have been generated. 1 means only one field value is connected to multiple filed values (*) of the common column(ky_id). The line arrow goes from Sheet1 to dt table which means the Cross-filter direction is single.
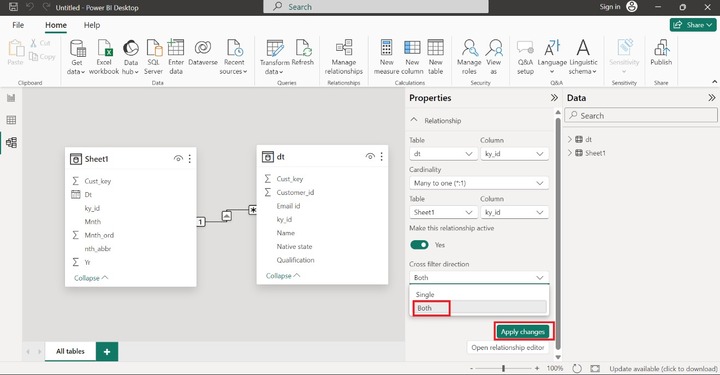
You may select "Both" under "Cross filter direction" from the "Properties" pane and click on "Apply changes".
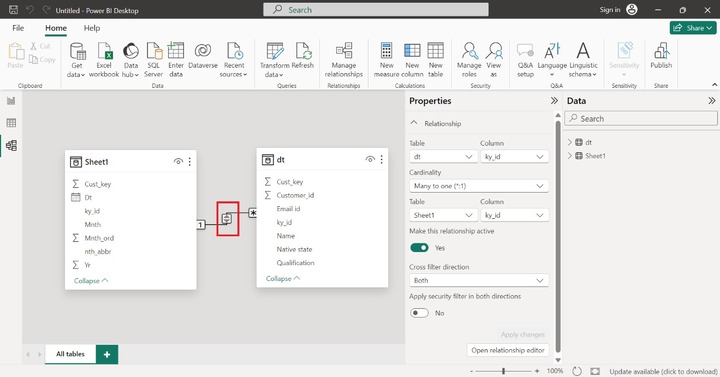
It resolves many issues while dealing with multiple datasets. You may observe in the snapshot, that the cross-filter direction has been modified and became bidirectional.
Strong Relationship and Weak Relationship
The solid line depicts the strong relationship among tables and the dotted lines indicate the weak relationship among tables in the Model View.
Types of Keys in Data Modeling
Various types of keys in Data Modeling are as follows −
Primary Key
The field that comprises the nonduplicate values and doesn't contain the empty values shows the primary key of the loaded tables.
Foreign Keys
When the primary key is found in the second table then it is considered a referential integrity/foreign key. If you wish to develop the One-to-One relationship among two tables, make sure that both tables contain the same column name with the same data type.
Composite Keys
Merging fields including the primary key's field might potentially ensure the distinctive nature of every field's values. You need to eliminate the duplicate field values and empty fields before creating the composite keys which are the main contributors in the datasets.
Key points to remember while managing relationships −
- Only a single association might be active at a time if there are several associations between two datasets.
- You may select only both or a Single cross-filter direction in the Property pane.
- Lots of relationships create ambiguity that makes data models complicated for the users.
- Circular relationships cannot be developed by the users.
- Model size would be decreased through relationships among tables.
Role-playing Dimensions
Suppose you have two tables that contain more than three one-to-many relationships. However, all relationships became inactive except one active relationship between tables. You may utilize the inactive relationship by developing the DAX expression in the BI desktop.
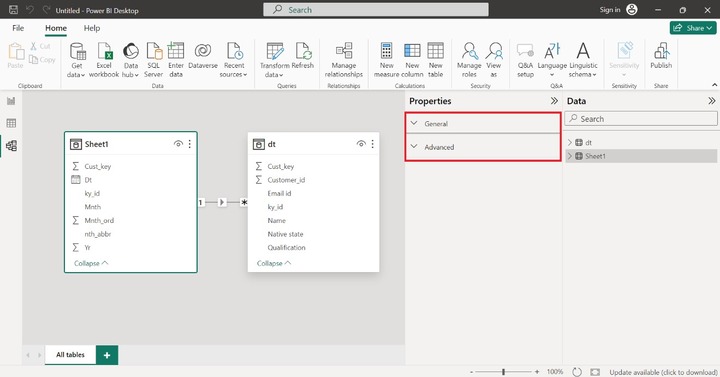
Table Configuration and Column Properties (General and Advanced)
You may click on any of the tables in Model View to view the "Properties" pane for the selected table. The "Properties" pane comprises two sections "General" and "Advanced".
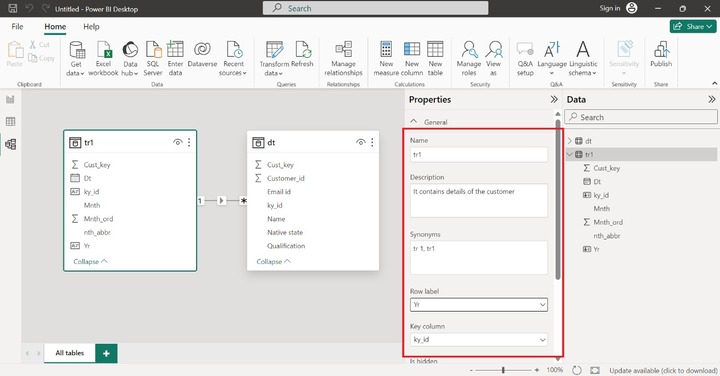
You may expand the "General" tile where so many options are available. You can enter the specific text like "tr1" under the Name section and write the description of the table in the next section "Description". Also, you can choose a specific column like "Yr" in the "Row Label" section and also select the ky_id in the "Key column" section.
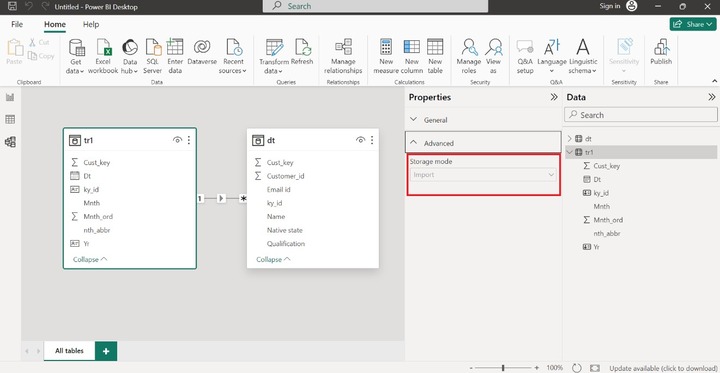
You can expand the Advanced tile where you can alter the Storage mode from "Import" to "Direct Query". Sometimes, this option is disabled due to inappropriate configuration.
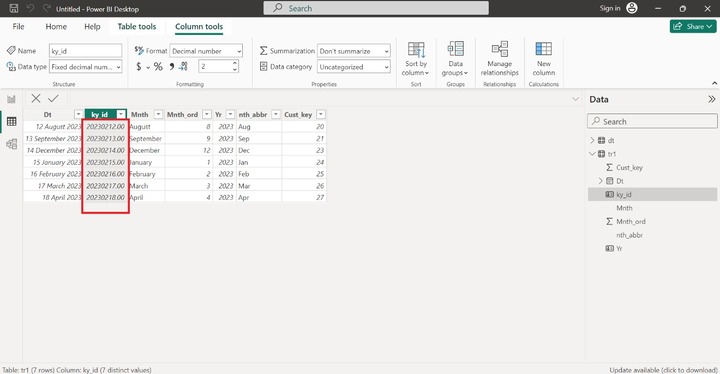
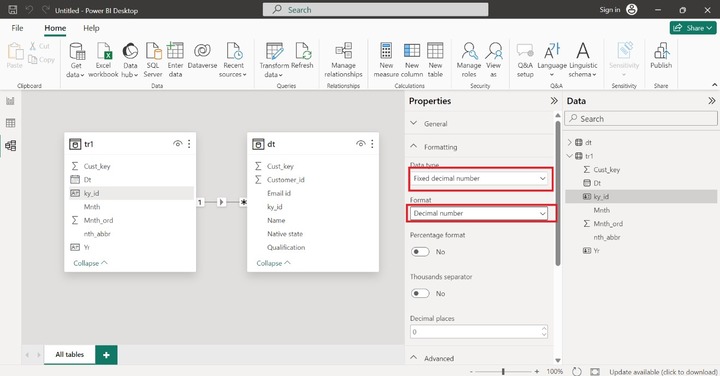
If you click on any numeric column then the "Formatting" section is populated in the "Properties" pane. For example: click on the ky_id column of the tr1 table. In the Formatting section, various options like "Data type", "Format", "Percent format" and "Thousand separator" are available.
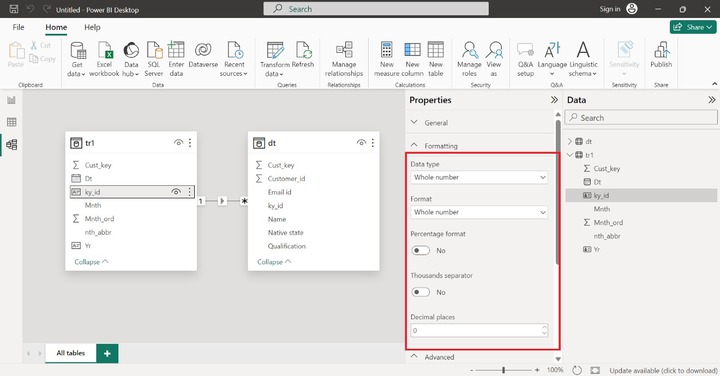
You may select the "Fixed decimal number" from the drop-down menu under "Data type" and alter the "Format" to "Decimal number".
You may switch to the "Table view" to see the custom formatting. Here, you can observe in the snapshots, the field values are in fixed decimal format.