- Power BI - Home
- Power BI - Introduction
- Power BI - Installation Steps
- Power BI - Architecture
- Power BI Desktop
- Power BI - Desktop
- Power BI - Desktop Window
- Power BI Service
- Power BI - Window Supported Browsers
- Power BI - Generating Reports
- Power BI Desktop Service
- Power BI - Desktop vs Service
- Power BI - Supported Data Sources
- Power BI - Comparison Tools
- Power Query Editor
- Power Query Editor - Introduction
- Power Query Editor - Data Discrepancy
- Power Query Editor - Merge Queries (Part 1)
- Power Query Editor - Merge Queries (Part 2)
- Power BI - Develop Star Schema
- Data Modeling Concepts
- Power BI - Data Modeling
- Power BI - Manage Relationships
- Power BI - Cardinality
- Power BI - Dashboard Options
- Power BI Report Visualizations
- Power BI - Visualization Options
- Power BI - Visualization Charts
- Power BI - Stacked Bar Chart
- Power BI - Stacked Column Chart
- Power BI - Clustered Chart
- Power BI - 100% Stacked Chart
- Power BI - Area Chart and Stacked Area Chart
- Power BI - Line and Stacked Column Chart
- Power BI - Line and Clustered Column Chart
- Power BI - Ribbon Chart
- Power BI - Table and Matrix Visuals
- Power BI Map Visualizations
- Power BI - Creating Map Visualizations
- Power BI - ArcGIS Map
- Power BI Miscellaneous
- Power BI - Waterfall Charts
- Funnel Charts and Radial Gauge Chart
- Power BI - Scatter Chart
- Power BI - Pie Chart and Donut Chart
- Power BI - Card and Slicer Visualization
- Power BI - KPI Visual
- Power BI - Smart Narrative Visual
- Power BI - Decomposition Tree
- Power BI - Paginated Report
- Power BI - Python Script & R Script
- Power BI - Multi-row Card
- Power BI - Power Apps & Power Automate
- Power BI - Excel Integration
- Power BI Dashboard
- Power BI - Sharing Dashboards
- Power BI Sales Production Dashboard
- Power BI - HR Analytics Dashboard
- Power BI - Customer Analytics Dashborad
- Power BI - DAX Basics
- Power BI - Administration Role
- Power BI - DAX Functions
- Power BI - DAX Text Functions
- Power BI - DAX Date Functions
- Power BI - DAX Logical Functions
- Power BI - DAX Counting Functions
- Power BI - Depreciation Functions
- Power BI - DAX Information Functions
Power BI - Paginated Report
What is a Paginated Report?
It is an alternative to an interactive report. These are considered pixel-perfect, and the originality of the page remains the same while printing these paginated reports, which means there is no loss of data and is effectively utilized in large business cases where millions of rows and columns exist. For example, bank account statements, card bills, and invoices are paginated reports.
The Power BI Report Builder tool is required to develop paginated reports. It is free of cost and is directly downloaded from the Microsoft website. This tool permits users to get connected to numerous data sources to build a paginated report. You can also publish and share the paginated report with your colleagues.
For PPU license or Pro license users, paginated reports can also be broadcast to other business users.
Dataset − You can import the file "C:\Users\Aarti\Downloads\New Report.rdl" into the Report Builder tool.
Generating a Paginated Report in the Report Builder Tool
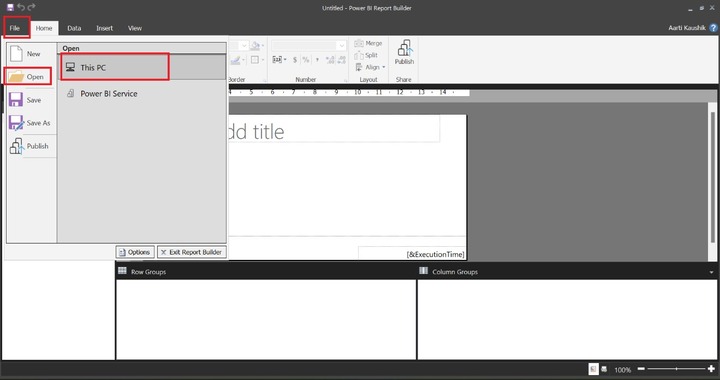
You can open the Report Builder tool and navigate to the File tab and then click on "Open" and select the .rdl file from "This PC".
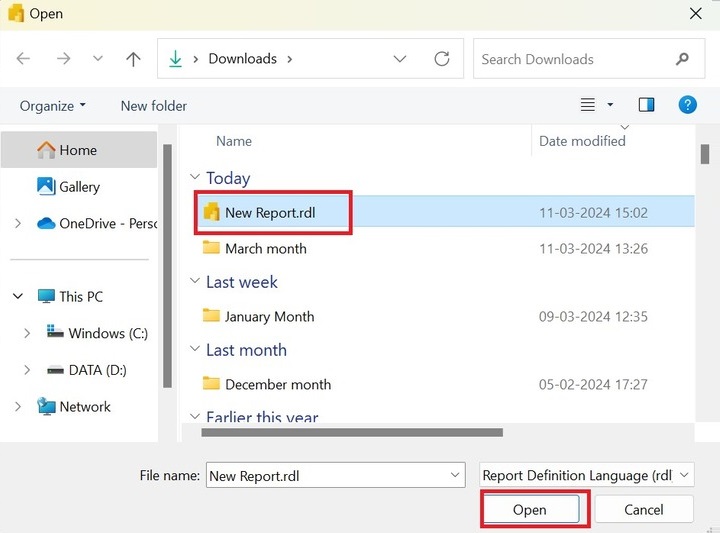
You can choose the specific file from the local system and click on the Open.
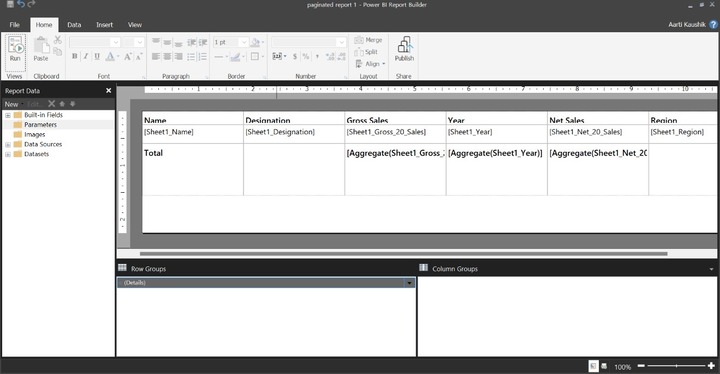
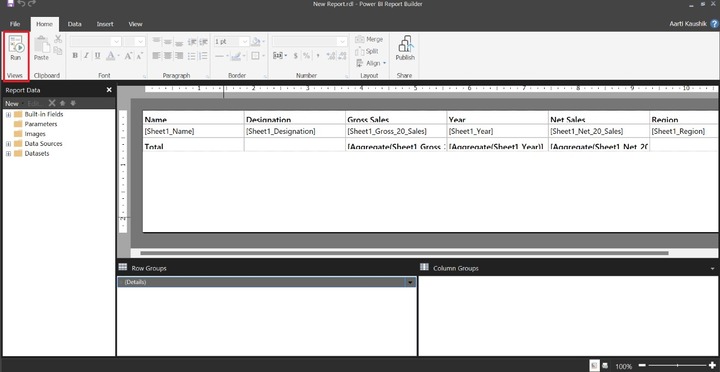
As you can observe in the screenshot, the design view of the report is shown where so many formatting options like Font, Paragraph, Border, Number, and Layout are available.
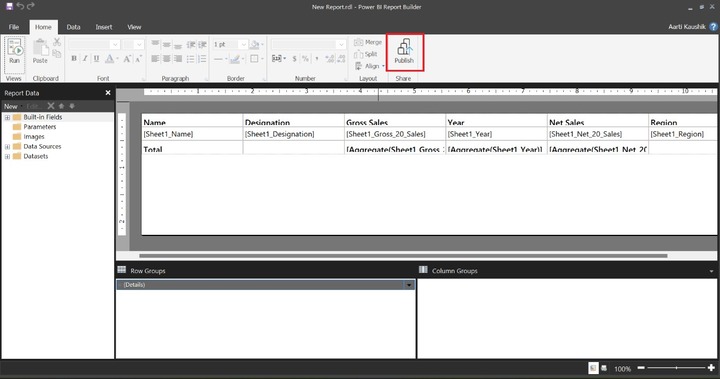
You can click on "Publish" for the connectivity with the Power BI service where you can broadcast the paginated report to other users.
Procedure to Render a Report with Field Values and Column Headings
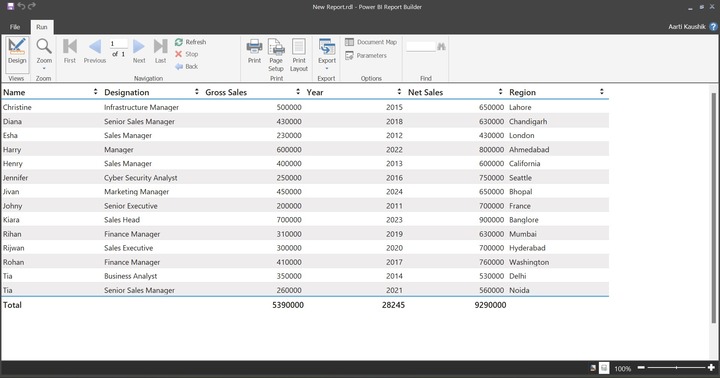
You need to sign in to your Microsoft account and then click on "Run" under "Views".
Therefore, the paginated report has been generated and you can swiftly take the print of this accurate pixel report by choosing the desired Print options "Print", "Page setup" and "Print Layout" that are available in the Print group in the "Run" tab.
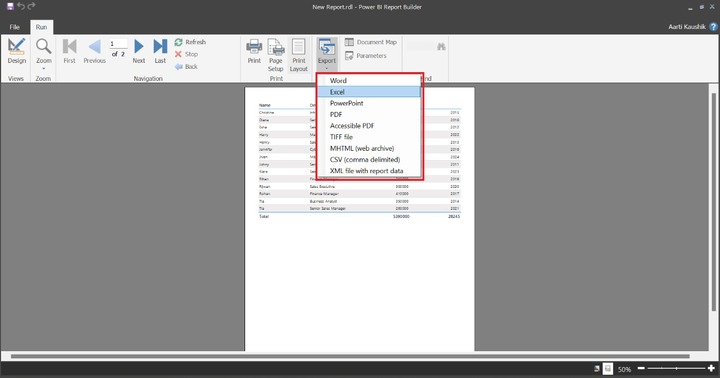
You can also export the paginated report into various formats like XML files with report data, Word, TIFF files, PDF, PowerPoint, and so on.
How to Develop a Paginated Report in BI Desktop?
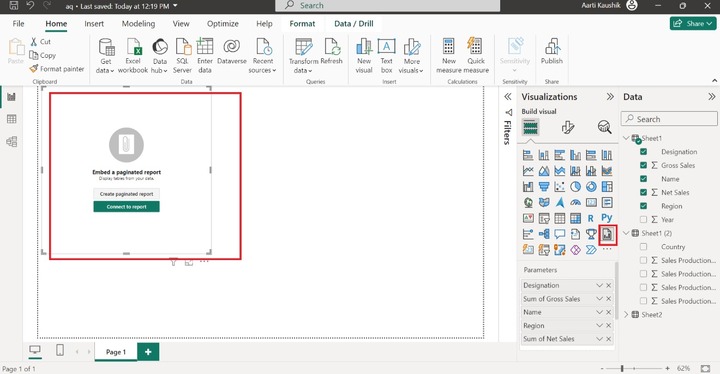
You can open the BI desktop and choose "Paginated Report" from the "Visualizations". You may select any of the two options "Create paginated report" and "Connect to report". Click on the "Create paginated report" which connects you to the Power BI service after the user sign in.
Now, you can select "aq" database from the list of the specified datasets and click on "Create paginated report".

You can select any of the desired worksheets from the "Data" pane. Lets click on "Sheet1" to develop the paginated report.
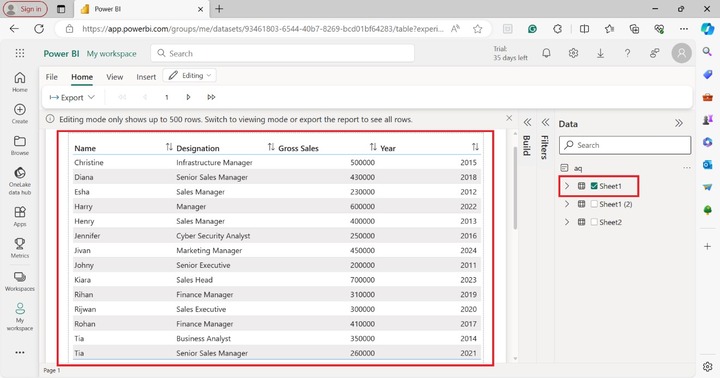
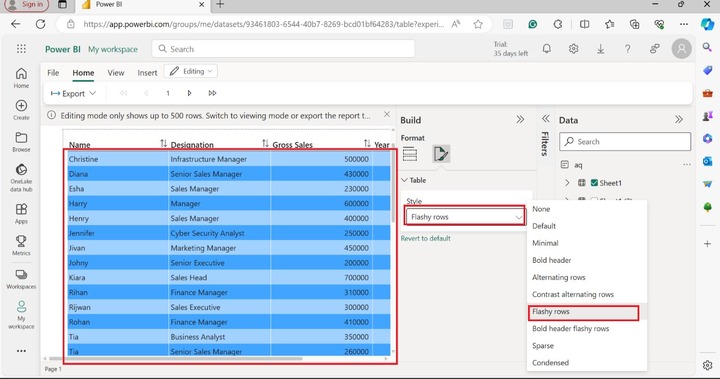
Now, you may expand the "Build" pane and select the "Format" tab where you can modify the formatting of the paginated report. You may choose the "Flashy rows" from the drop-down list under the "Style" section.
Generating a Paginated Report Directly in Power BI Service
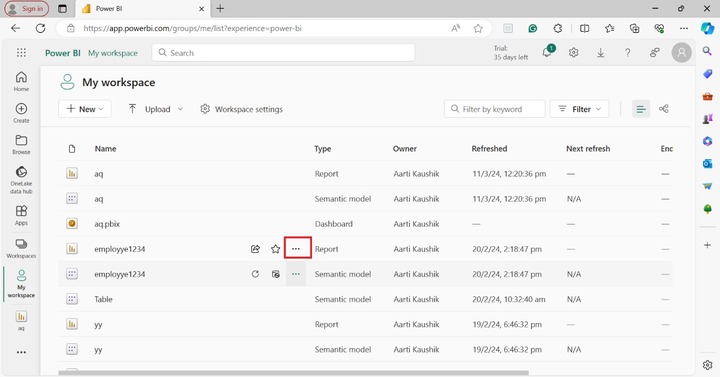
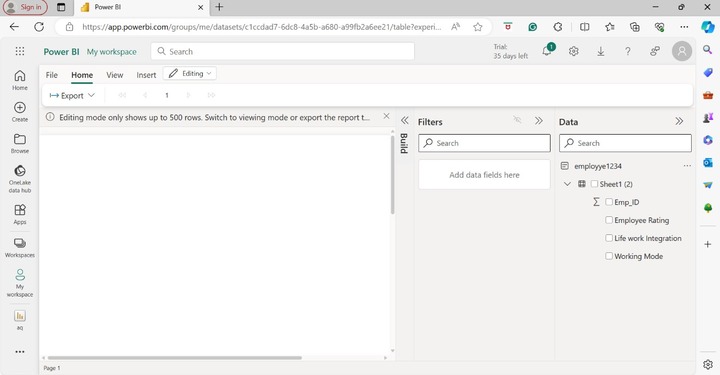
You may directly sign in at https://app.powerbi.com/ and go to "My Workspace" where so many reports and semantic models have already been created.
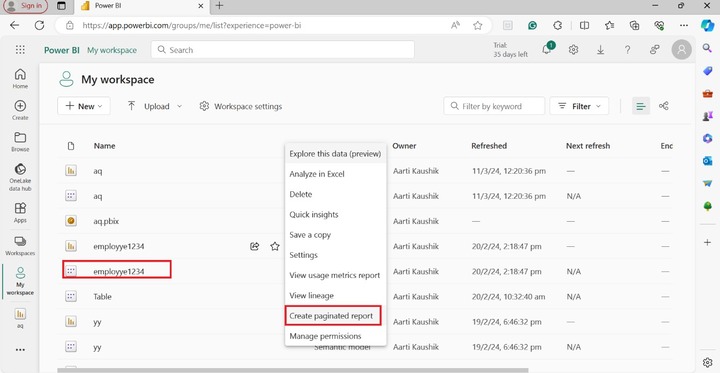
For instance − You may choose "employye1234", click on the more options, and select "Create paginated report" from the mentioned list.
Now, you can notice that a blank paginated report is generated that contains no fields.

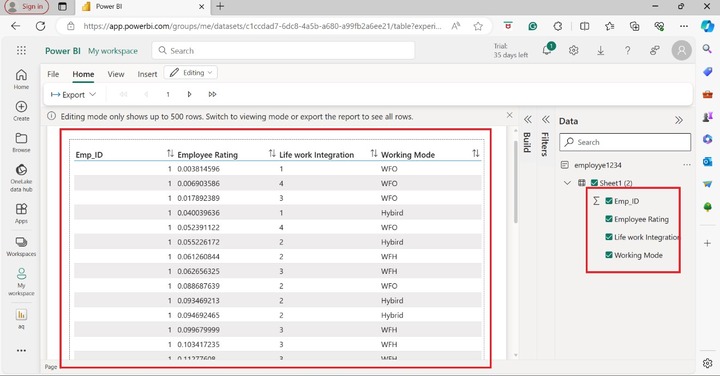
You may select the "Emp_ID", "Employee Rating", "Life work Integration" and "Working Mode" from the "Data" pane.
Therefore, the paginated report has been generated that best fits the page.
Difference between Paginated Reports and BI Reports
Business users may use any of these reports according to their business requirements. For interactive reports, better to use BI reports.
| Feature | Paginated Reports | BI Reports |
|---|---|---|
| Nature | These are generally used for printing, and all the pages perfectly fit on a paginated report. | These are interactive in nature and more flexible. |
| Format | .rdl extension is used for paginated reports. | .pbix extension is used for BI reports. |
| Characteristics | DAX expression cannot be implemented, filtration or sorting of the field value can be done. | For complex modeling, DAX expression is effectively employed in the BI reports. |
| Data Model | It is restricted to structured and simple data sources and is not efficient for complicated data models. | Its flexibility allows users to work with a wide variety of data sources and many complicated data models may also be developed. |
| Joining multiple tables | SQL joins are used to develop the relationships among tables. | With the aid of a data model, the relationship among various datasets is permitted. |
Limitations of Paginated Reports
- Complex data models and their relationship cannot be created for the Paginated report.
- Users encounter difficulty in opening files other than .rdl extensions as other formats are not supported in the Power BI Report Builder tool.