- Power BI - Home
- Power BI - Introduction
- Power BI - Installation Steps
- Power BI - Architecture
- Power BI Desktop
- Power BI - Desktop
- Power BI - Desktop Window
- Power BI Service
- Power BI - Window Supported Browsers
- Power BI - Generating Reports
- Power BI Desktop Service
- Power BI - Desktop vs Service
- Power BI - Supported Data Sources
- Power BI - Comparison Tools
- Power Query Editor
- Power Query Editor - Introduction
- Power Query Editor - Data Discrepancy
- Power Query Editor - Merge Queries (Part 1)
- Power Query Editor - Merge Queries (Part 2)
- Power BI - Develop Star Schema
- Data Modeling Concepts
- Power BI - Data Modeling
- Power BI - Manage Relationships
- Power BI - Cardinality
- Power BI - Dashboard Options
- Power BI Report Visualizations
- Power BI - Visualization Options
- Power BI - Visualization Charts
- Power BI - Stacked Bar Chart
- Power BI - Stacked Column Chart
- Power BI - Clustered Chart
- Power BI - 100% Stacked Chart
- Power BI - Area Chart and Stacked Area Chart
- Power BI - Line and Stacked Column Chart
- Power BI - Line and Clustered Column Chart
- Power BI - Ribbon Chart
- Power BI - Table and Matrix Visuals
- Power BI Map Visualizations
- Power BI - Creating Map Visualizations
- Power BI - ArcGIS Map
- Power BI Miscellaneous
- Power BI - Waterfall Charts
- Funnel Charts and Radial Gauge Chart
- Power BI - Scatter Chart
- Power BI - Pie Chart and Donut Chart
- Power BI - Card and Slicer Visualization
- Power BI - KPI Visual
- Power BI - Smart Narrative Visual
- Power BI - Decomposition Tree
- Power BI - Paginated Report
- Power BI - Python Script & R Script
- Power BI - Multi-row Card
- Power BI - Power Apps & Power Automate
- Power BI - Excel Integration
- Power BI Dashboard
- Power BI - Sharing Dashboards
- Power BI Sales Production Dashboard
- Power BI - HR Analytics Dashboard
- Power BI - Customer Analytics Dashborad
- Power BI - DAX Basics
- Power BI - Administration Role
- Power BI - DAX Functions
- Power BI - DAX Text Functions
- Power BI - DAX Date Functions
- Power BI - DAX Logical Functions
- Power BI - DAX Counting Functions
- Power BI - Depreciation Functions
- Power BI - DAX Information Functions
Power Apps and Power Automate
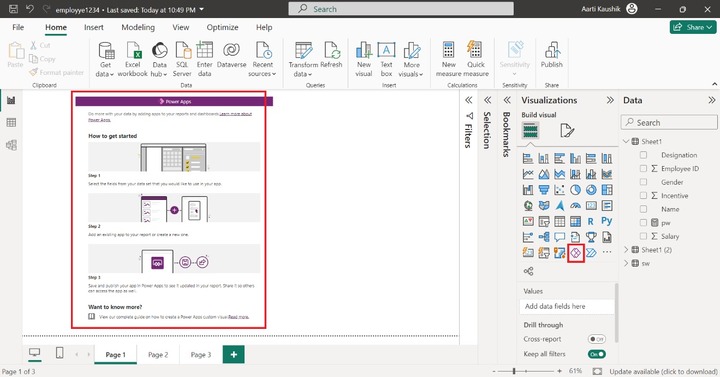
Power Apps in Power BI
It allows you to make swift business decisions and develop stunning forms, smooth workflow, and deliver top-notch business solutions for the company. The built-in components and templates are available that decrease the user's time and develop the interactive apps without any extensive coding experience.
Step 1 − You may click on the "Power Apps for Power BI" visual under Visualizations.
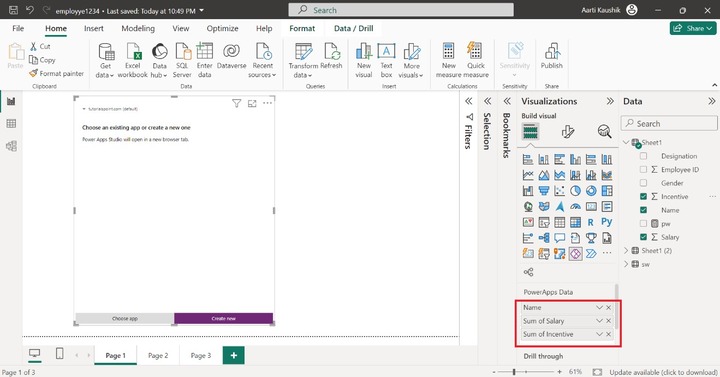
Step 2 − You can click on any area of the Power Apps and place the "Name", "Salary" and "Incentive" fields under the "PowerApps Data" section. Now, you may click on the "Create new".
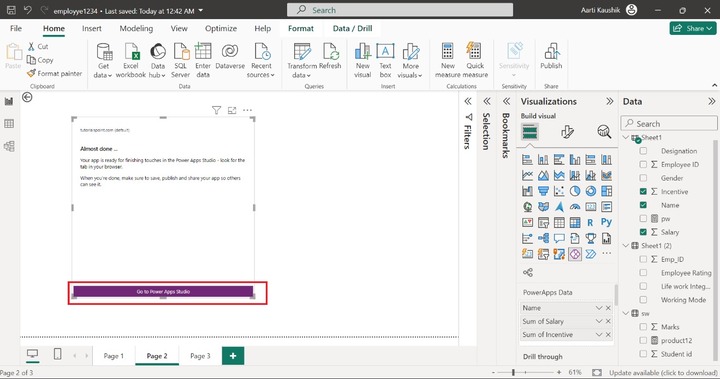
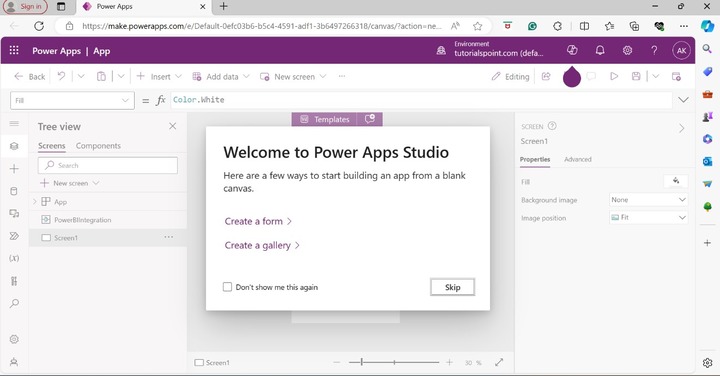
Furthermore, click on the "Go to Power Apps Studio " that navigates you to the Power Apps studio.
Now, you have two options, either you may develop a form where you can add different controls on it or generate a gallery.
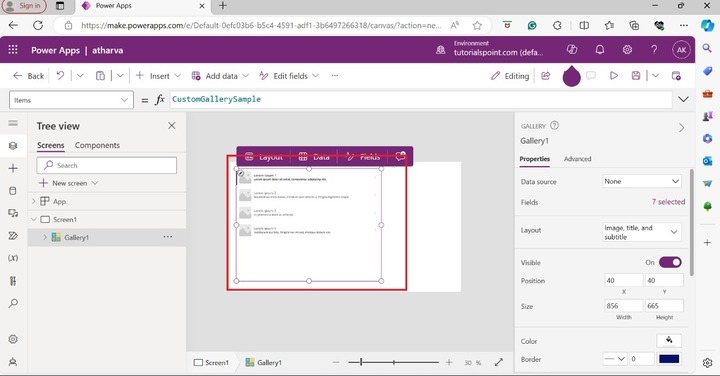
Step 3 − Now, you can click on "Create a gallery". The default sample gallery has been generated as shown below.
Step 4 − You may also upload the stock images and other images from the local system. Go to the "Properties" tab and click on the "+ Upload".
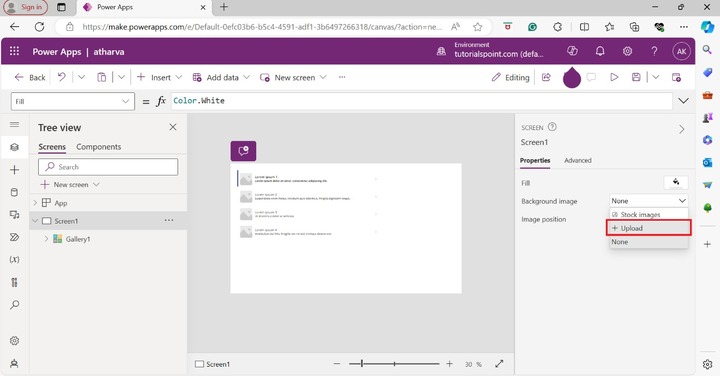
As you can see, the background images of the gallery have been changed. There are so many controls that you may add in this gallery.
Note − The brief of the Power apps for power visuals is depicted in this chapter.
Power Automate in Power BI
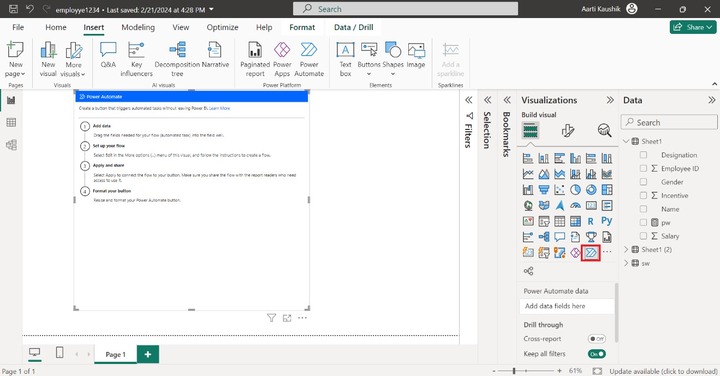
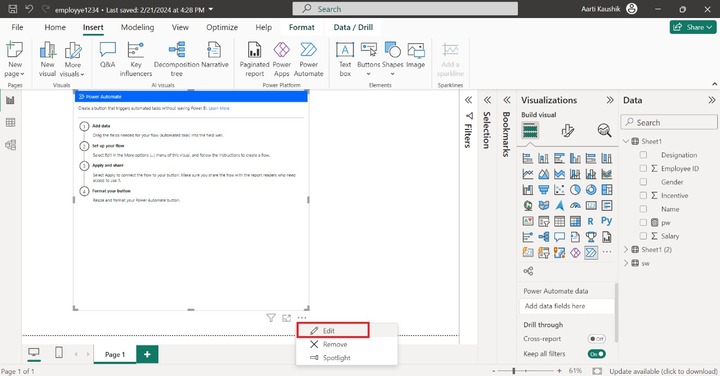
Step 1 − The first step is to load the specified dataset in Bi desktop. You may select the "Power Automate for Power BI" visual from the Visualizations pane. After selecting this visual. The Power Automate default page has been populated showing the various steps to develop the button that set off the automated tasks.
Step 2 − You may click on the More options(...) and select the "Edit".
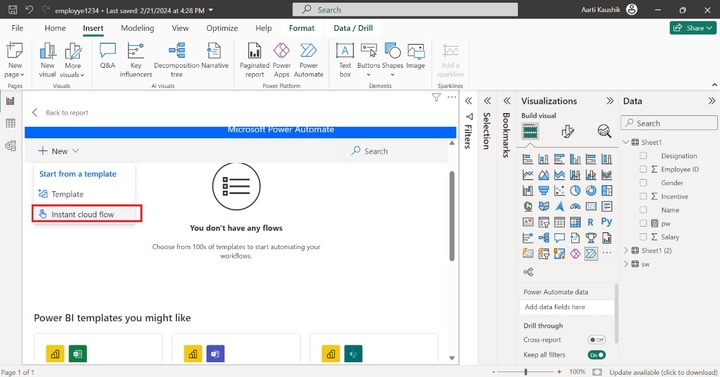
Step 3 − You may click on the "Instant cloud flow" as shown in the below image.
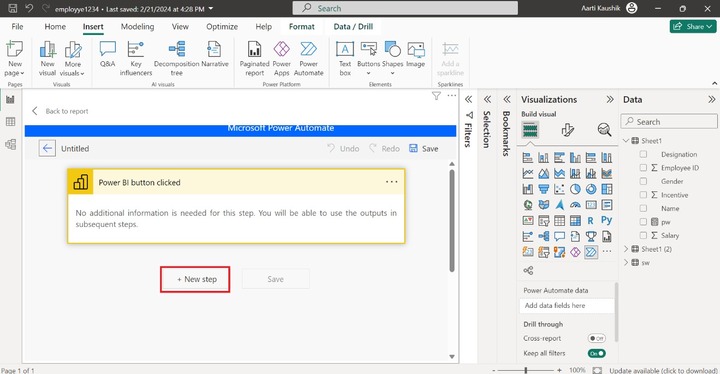
Step 4 − After that, you may click on the "New step".
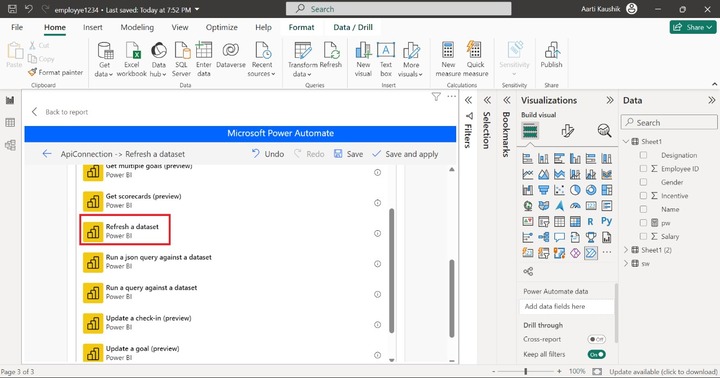
Step 5 − You may type "Power BI" in the given textbox and select the "Power BI" option under "ALL".
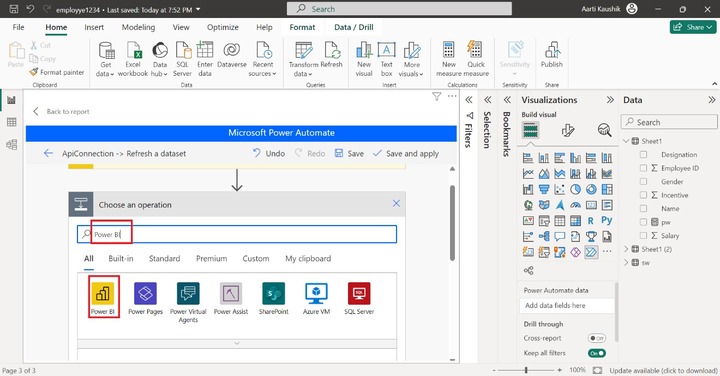
Step 6 − You may choose the "Refresh a dataset" option from the drop-down list and then click on "Save and apply".
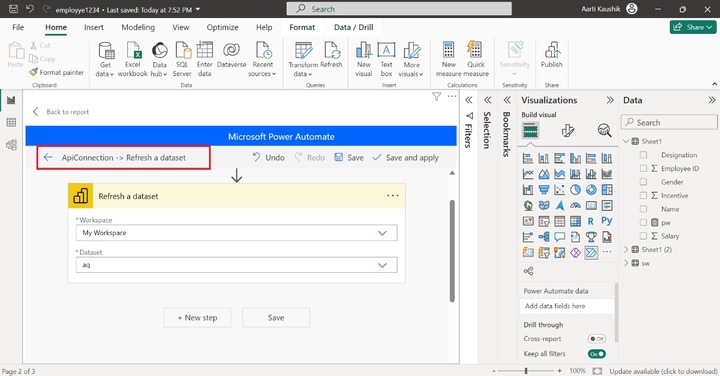
Step 7 − You can select "My workspace" under "Workspace" and choose the specified dataset "aq" under "Dataset". Now you may click on the left arrow "ApiConnection->Refresh a dataset".
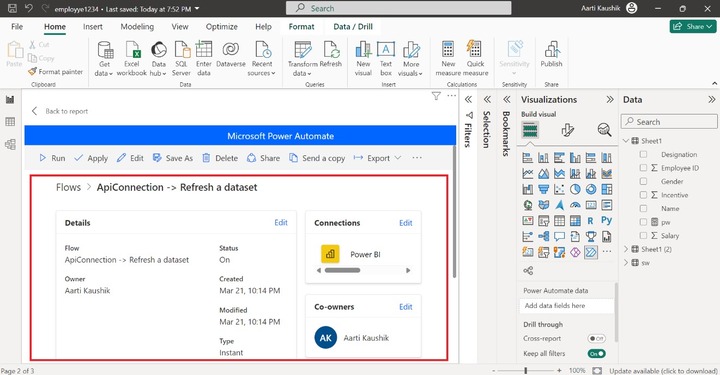
Step 8 − As you can see in the screenshot, the details of the flows are shown. Now, you may click on the "Flows".
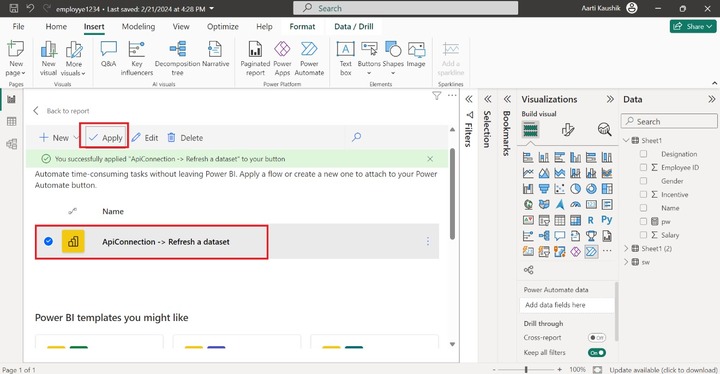
Step 9 − You may tick the Radio Button adjacent to "ApiConnection -> Refresh a dataset" then select "Apply" and then click on "Back to report".
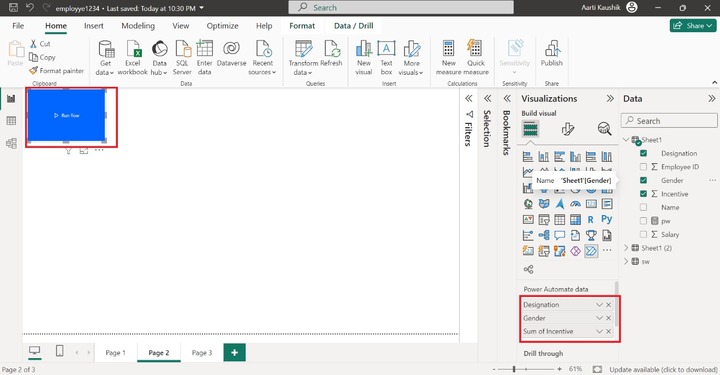
Step 8 − Therefore, a button is created that triggers the repeated tasks. You may adjust the size of the "Run Flow" button on the canvas. Now, click on the button and place the "Designation", "Gender", and "Incentive" fields into the "Power Automate Data" section.
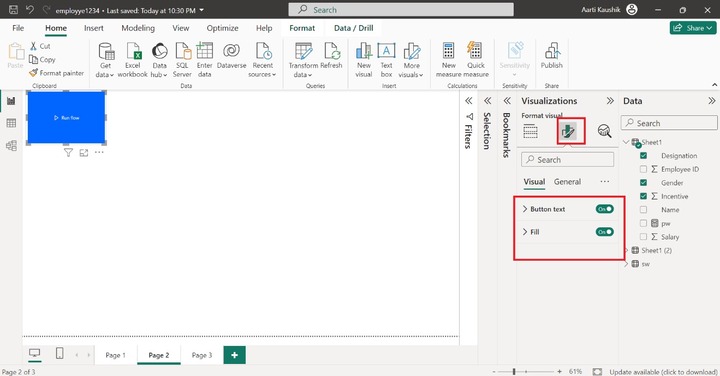
Step 9 − You may also customize the generated button. Click on the "Format visual" where two options "Button text" and "Fill" options are available.
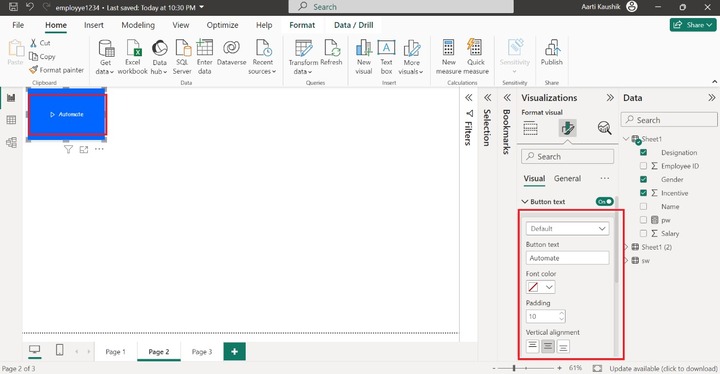
Step 10 − You can expand the "Button text" tile, type the "Automate" under "Button text", increase the Text size to 12, and select the "Comic Sans MS" under the "Font family" section.
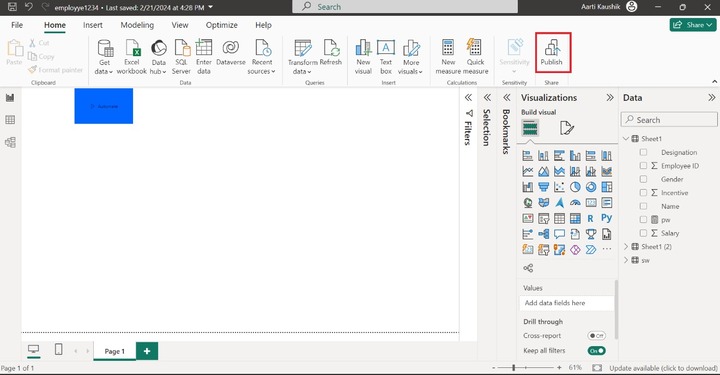
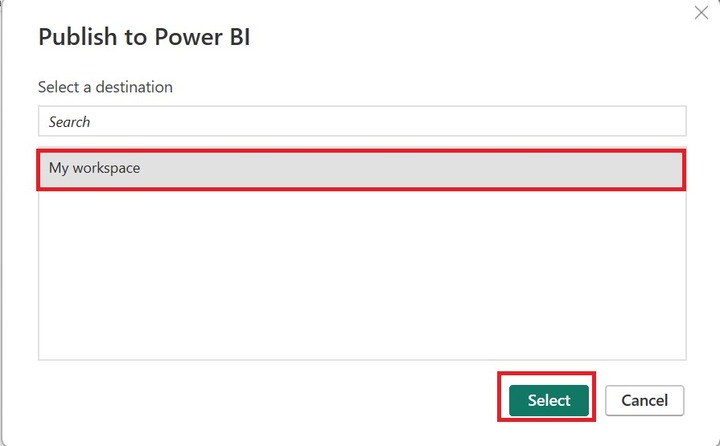
Step 11 − If you wish to share the flow with colleagues, then click on "Publish".
Step 12 − You may choose the "My workspace" and then click on the "Select" button.
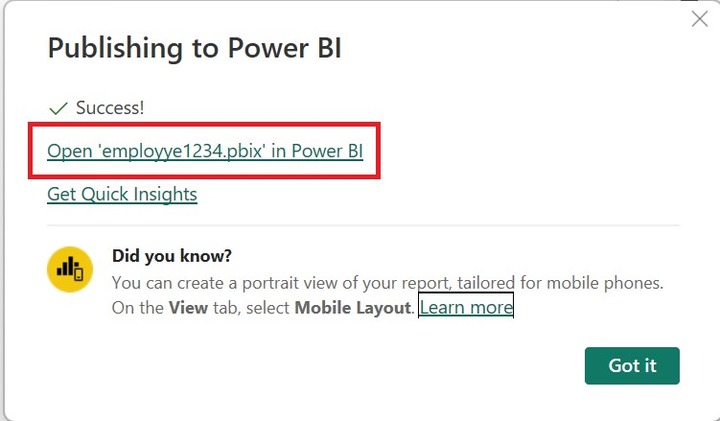
Step 13 − You can open the "employee1234.pbix" in Power BI service and click on "Got it".
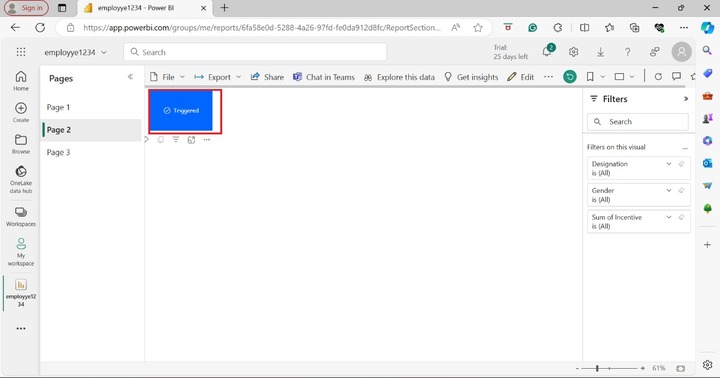
Step 14 − Now, the report is open in the BI service, and then click on the "Automate" button to execute it.
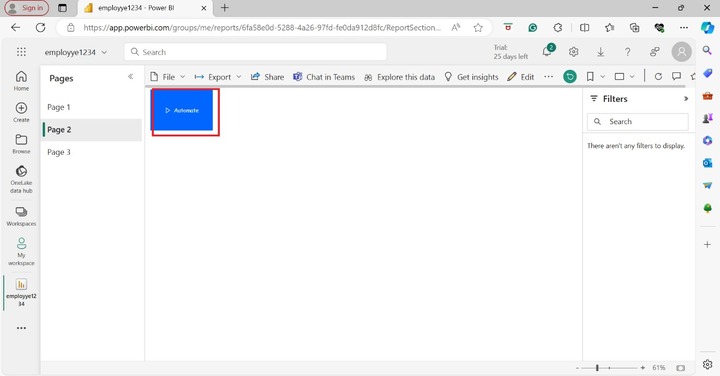
As you can observe in the screenshot, the flow is successfully triggered.