- Power BI - Home
- Power BI - Introduction
- Power BI - Installation Steps
- Power BI - Architecture
- Power BI Desktop
- Power BI - Desktop
- Power BI - Desktop Window
- Power BI Service
- Power BI - Window Supported Browsers
- Power BI - Generating Reports
- Power BI Desktop Service
- Power BI - Desktop vs Service
- Power BI - Supported Data Sources
- Power BI - Comparison Tools
- Power Query Editor
- Power Query Editor - Introduction
- Power Query Editor - Data Discrepancy
- Power Query Editor - Merge Queries (Part 1)
- Power Query Editor - Merge Queries (Part 2)
- Power BI - Develop Star Schema
- Data Modeling Concepts
- Power BI - Data Modeling
- Power BI - Manage Relationships
- Power BI - Cardinality
- Power BI - Dashboard Options
- Power BI Report Visualizations
- Power BI - Visualization Options
- Power BI - Visualization Charts
- Power BI - Stacked Bar Chart
- Power BI - Stacked Column Chart
- Power BI - Clustered Chart
- Power BI - 100% Stacked Chart
- Power BI - Area Chart and Stacked Area Chart
- Power BI - Line and Stacked Column Chart
- Power BI - Line and Clustered Column Chart
- Power BI - Ribbon Chart
- Power BI - Table and Matrix Visuals
- Power BI Map Visualizations
- Power BI - Creating Map Visualizations
- Power BI - ArcGIS Map
- Power BI Miscellaneous
- Power BI - Waterfall Charts
- Funnel Charts and Radial Gauge Chart
- Power BI - Scatter Chart
- Power BI - Pie Chart and Donut Chart
- Power BI - Card and Slicer Visualization
- Power BI - KPI Visual
- Power BI - Smart Narrative Visual
- Power BI - Decomposition Tree
- Power BI - Paginated Report
- Power BI - Python Script & R Script
- Power BI - Multi-row Card
- Power BI - Power Apps & Power Automate
- Power BI - Excel Integration
- Power BI Dashboard
- Power BI - Sharing Dashboards
- Power BI Sales Production Dashboard
- Power BI - HR Analytics Dashboard
- Power BI - Customer Analytics Dashborad
- Power BI - DAX Basics
- Power BI - Administration Role
- Power BI - DAX Functions
- Power BI - DAX Text Functions
- Power BI - DAX Date Functions
- Power BI - DAX Logical Functions
- Power BI - DAX Counting Functions
- Power BI - Depreciation Functions
- Power BI - DAX Information Functions
Power Query Editor - Merge Queries (Part 2)
Inner Join and Left Outer Join
The inner join merges two tables and extracts only those records that contain the matching values in the common column of both tables. The left-outer join also matches the common values from the two tables but retrieves all the first table records along with the corresponding records of the matched values from the second table.
Implementation of Inner Join in Power BI
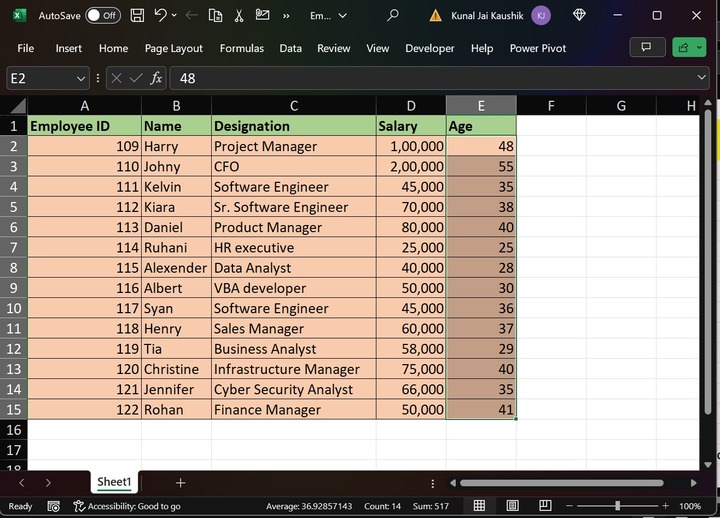
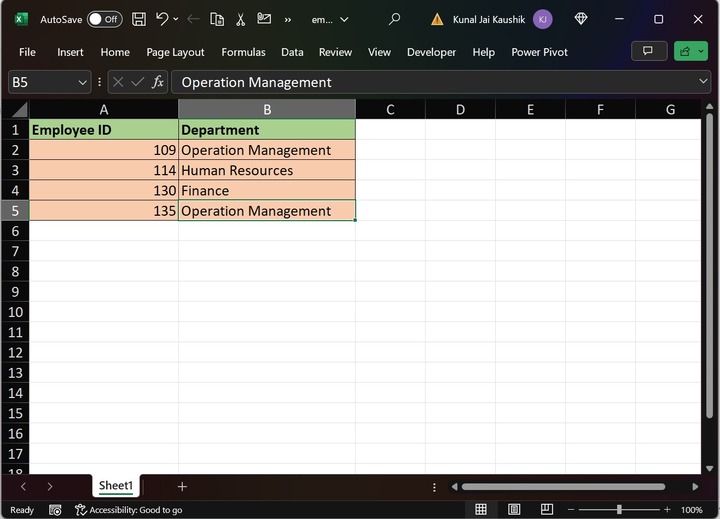
Step 1 − Users need to load two tables named employee.xls and emp_dept.xls in Power BI. The structure of these tables is shown below −
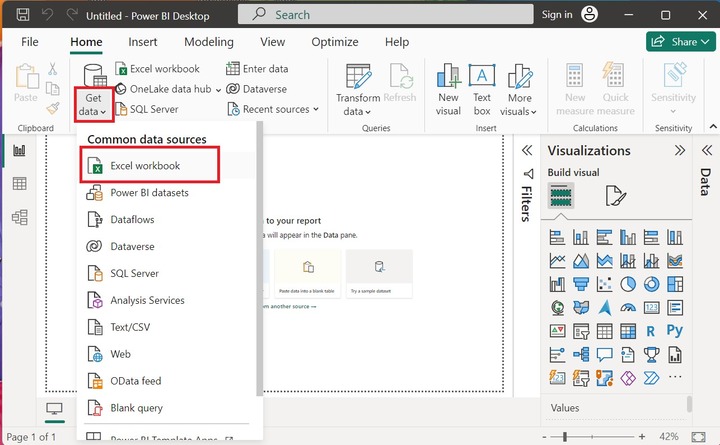
Step 2 − Open "Power BI Desktop" and then navigate to the "Home" tab and choose the "Get data" option to load the Excel workbook as highlighted below image −

Step 3 − Select the specific location of the Excel workbook from the system like this. After that, click on the "Open" button.

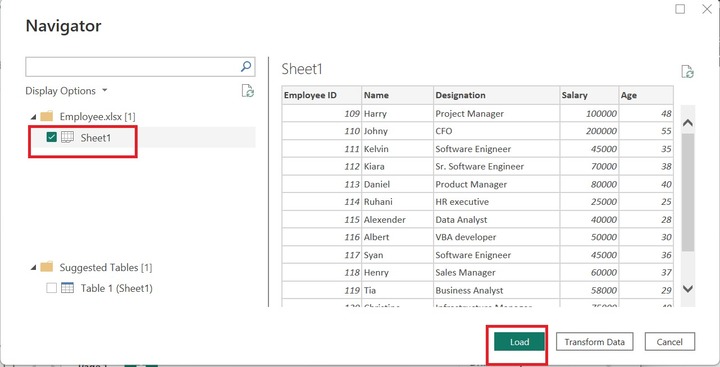
Step 3 − The "Navigator" dialog box will appear. Here you see, the Excel workbook "Employee" is being displayed that contains only one worksheet "Sheet1". Now, choose the "Sheet1" checkbox and then click on the "Load" button as given below −
Repeat the similar steps for the second table emp_dept.xls to load the second table in the Power BI.
Step 4 − You can see the two tables are imported in the Power BI desktop. Once you click on Sheet1 under the "Data" section, the complete information of the Employee table is displayed as shown below image −

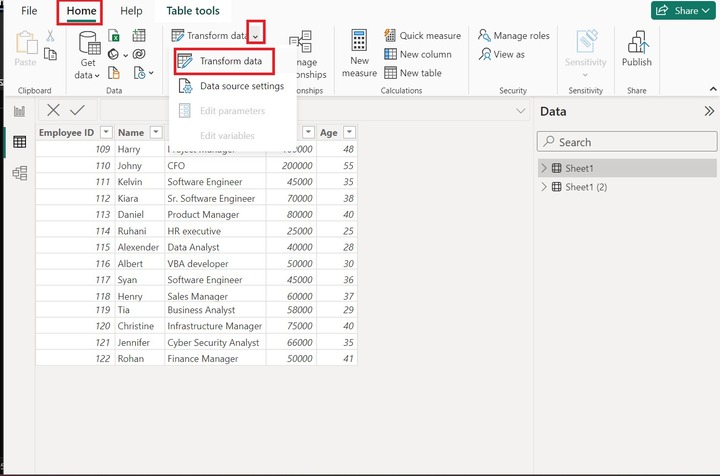
Step 5 − Switch to the "Home" tab and then click on the Transform data tile and then select the Transform data option as given below −
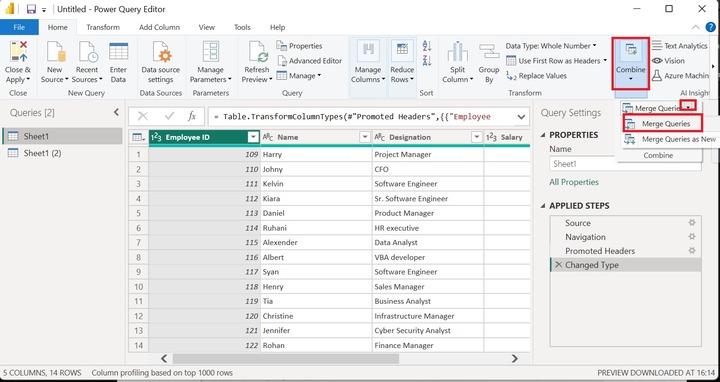
Step 6 − The Power Query Editor window will appear. Click on the "Combine" tile, expand the Merge Queries tile, and select the "Merge Queries" option as given below −

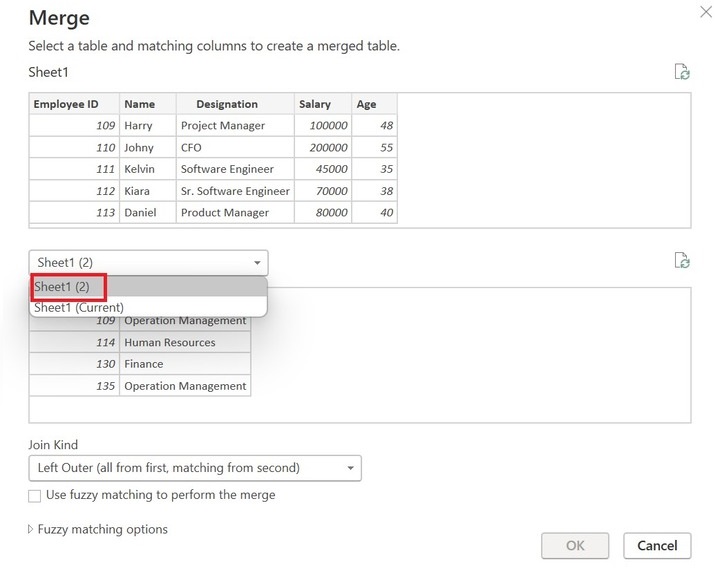
Step 7 − Another dialog box "Merge" will open. Choose the Sheet1(2) table from the drop-down menu as highlighted below image −
Step 8 − Choose the "Inner(only matching rows)" option under the "Join Kind" section and select the common column Employee ID in both Table Sheet1 and Sheet1(2). Furthermore, click on the "OK" button.
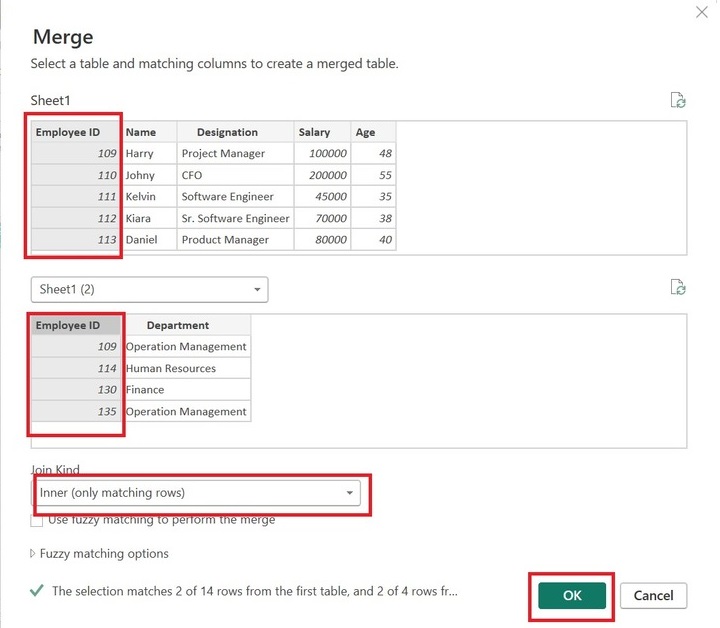
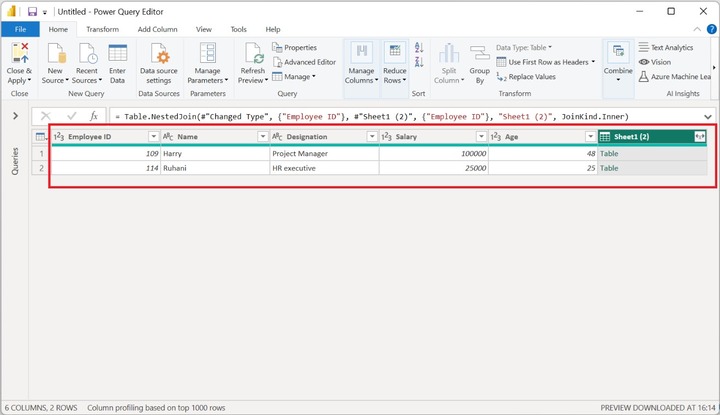
Step 9 − You can see only two rows are matched out of 14 rows, and their corresponding records are retrieved as shown in the below image.
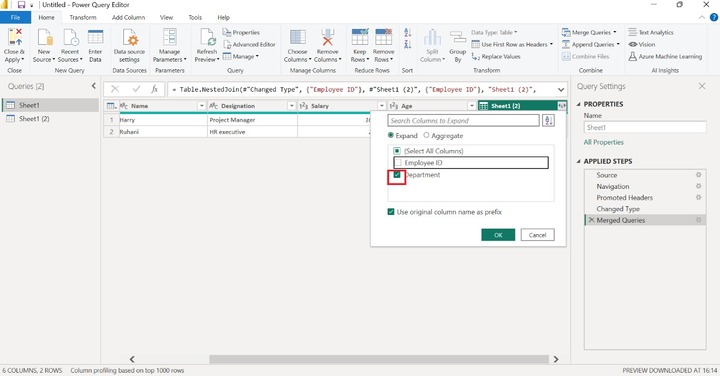
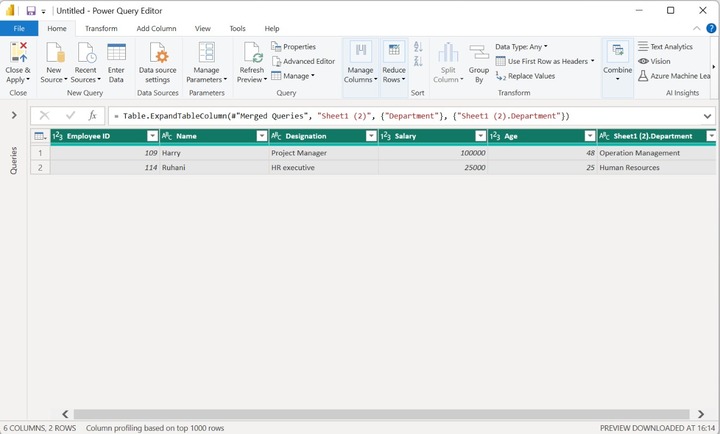
Step 10 − To showcase their department, you can click on the Sheet1(2) column bidirectional arrow select only the Department column and click on the OK button.
Left Outer Join in Power Query Editor
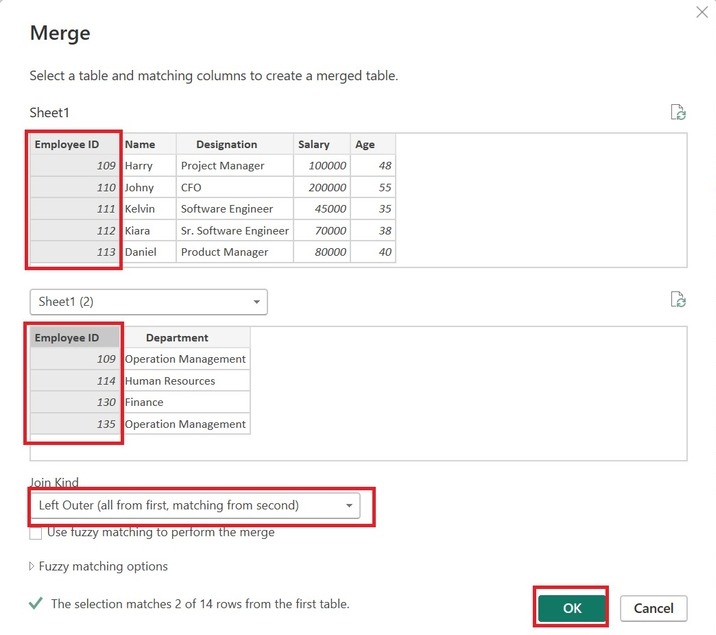
Step 1 − Go to Step 5 of the previous example, and choose the "Left Outer(all from first, matching from second)" option under the "Join Kind" section. Also, select the common field Employee ID in both tables as depicted in the below image. Finally, users need to click the "OK" button.
Step 2 − The finalized table is depicted in the below image −
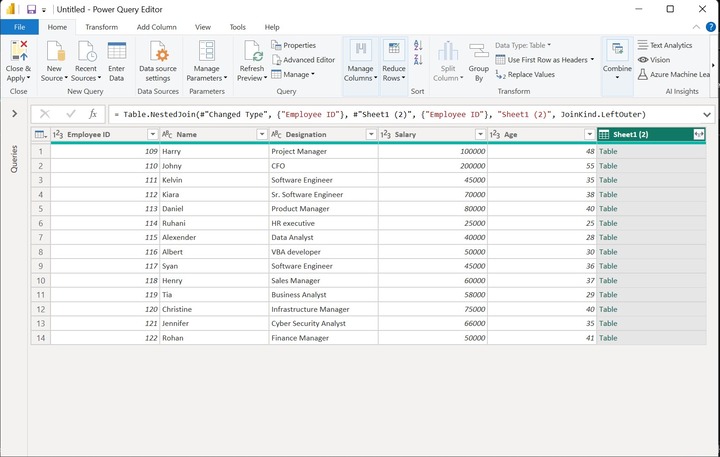
Step 3 − Suppose you wish to see the corresponding department of the matched values; in that case, you can click on the double arrow just adjacent to the Sheet1(2) column untick the Employee ID checkbox, and select only the Department checkbox. Moreover, click on the OK button.
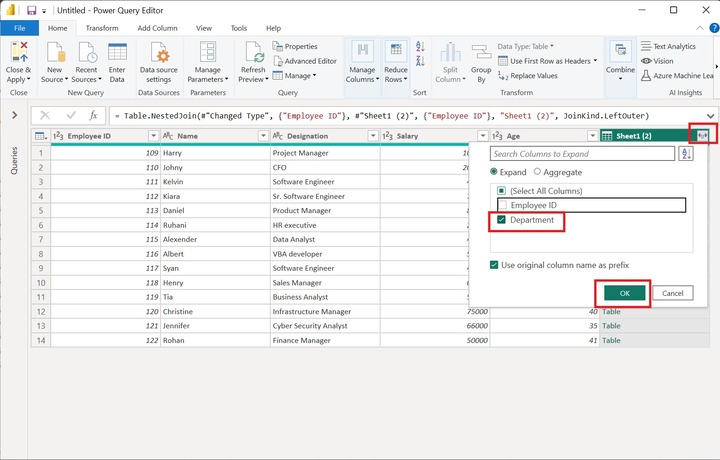
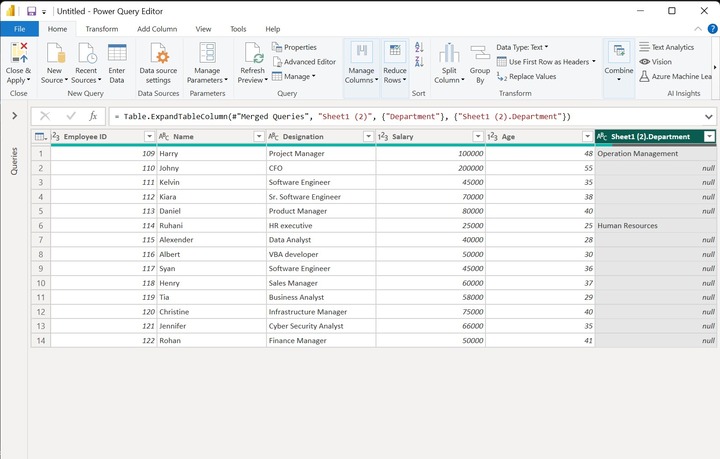
Note: If the records are not matched, then null is retrieved in the Department column.
What is Full Outer Join?
The Full Outer Join where all the records from both tables are to be retrieved based on the equivalent value presented in the tables common column. If there are any missing matches in any of the tables, null values must be entered.
Example
Step 1 − Click on the "Power BI Desktop" icon, switch to the "Home" tab select the "Get data" tile and select the first option "Excel workbook" to load the two tables named Employee.xls and Department.xlsx separately.
Step 2 − Select the file name from the specified location of the system and then click on the "Open" button.
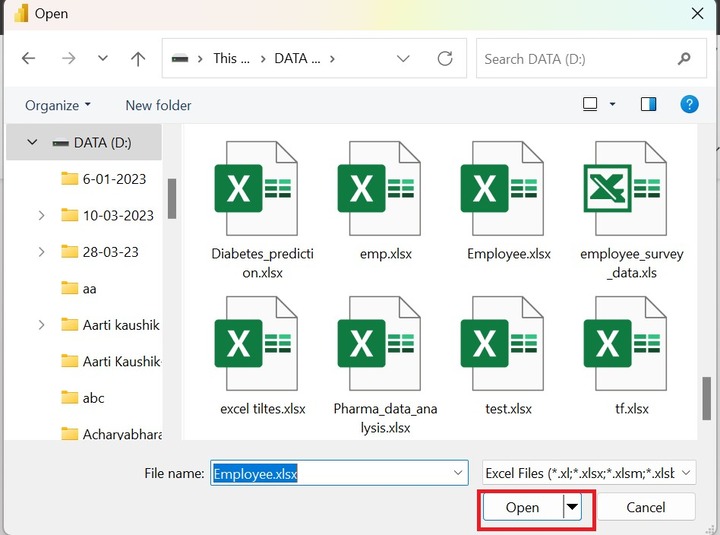
Step 3 − You can see the preview of the Employee table depicted in the Navigator window. Users need to choose the "Sheet1" checkbox and press the "Load" button as given below −

Users need to follow the same steps to load the second table Department.xlsx in the Power BI.
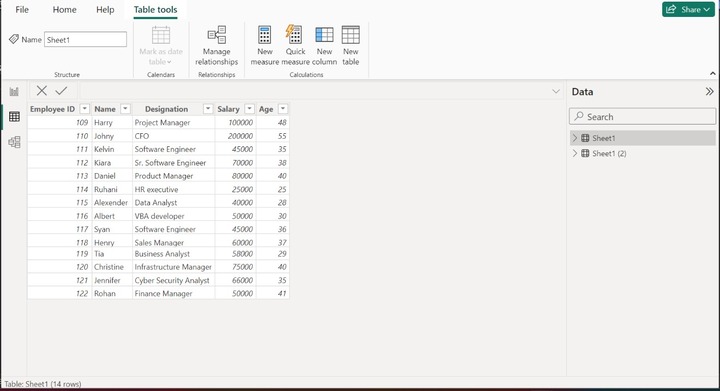
Step 4 − You can see the two tables are imported in the Power BI desktop. Once you click on Sheet1 under the "Data" section, the complete information of the Employee table is displayed as shown below image:
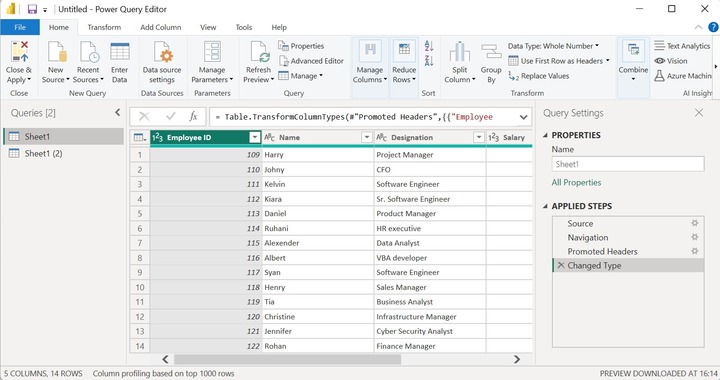
Step 5 − You must select the "Home" tab and then expand the Transform data tile and then select the Transform data option as highlighted below image:

Step 6 − The Power Query Editor window will appear. Click on the "Combine" tile, expand the Merge Queries tile, and select the "Merge Queries" option as given below −

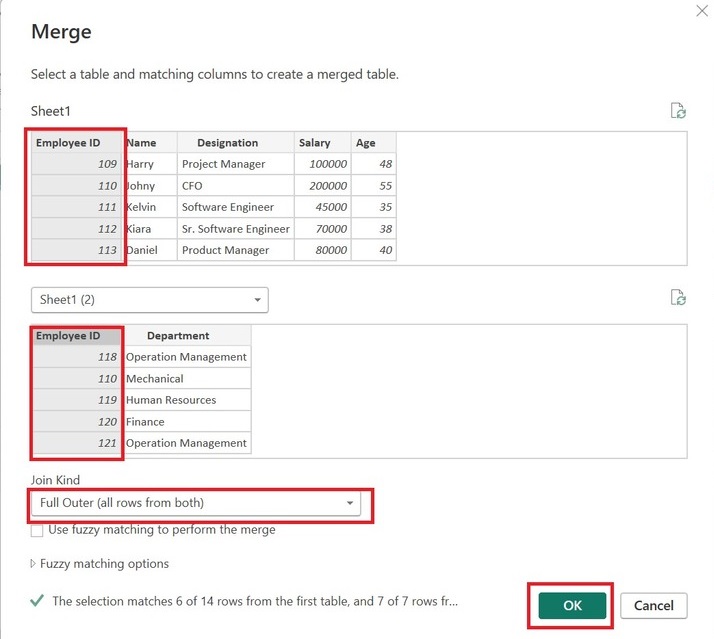
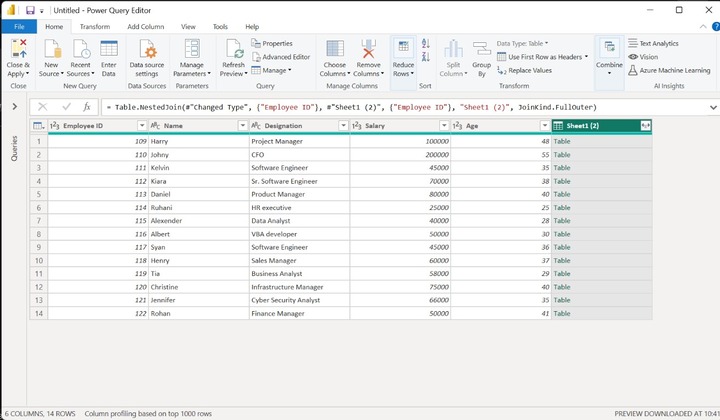
Step 7 − The "Merge" dialog Box will open where users can select the "Employee ID" column in both tables as it contains the few common IDs. Now, select the "Full Outer(all rows from both)" from the list presented under the "Join Kind" and then click on the OK button.
Step 8 − The resultant table is given below:
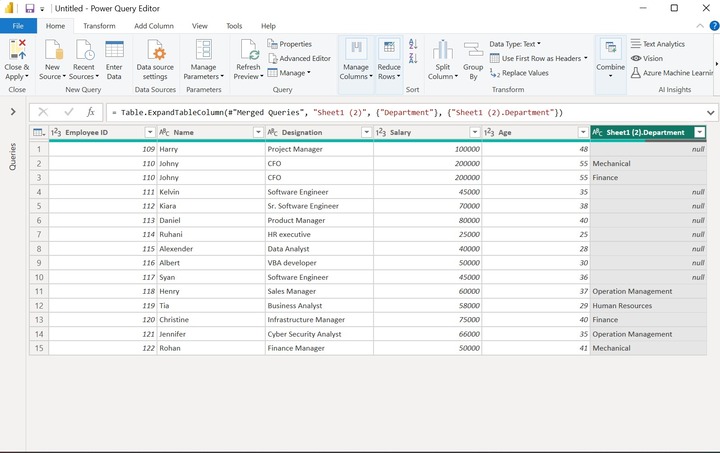
Step 9 − Expand the "Sheet1(2)" column double arrow tick the Department checkbox and click on the OK button as given below −
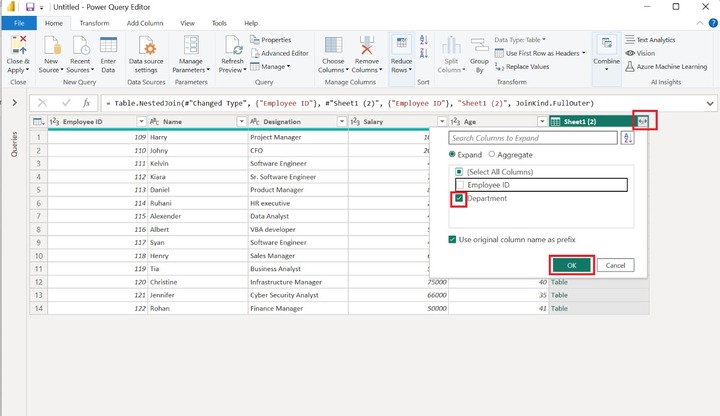
You can see that all the rows from both tables are extracted.