- Power BI - Home
- Power BI - Introduction
- Power BI - Installation Steps
- Power BI - Architecture
- Power BI Desktop
- Power BI - Desktop
- Power BI - Desktop Window
- Power BI Service
- Power BI - Window Supported Browsers
- Power BI - Generating Reports
- Power BI Desktop Service
- Power BI - Desktop vs Service
- Power BI - Supported Data Sources
- Power BI - Comparison Tools
- Power Query Editor
- Power Query Editor - Introduction
- Power Query Editor - Data Discrepancy
- Power Query Editor - Merge Queries (Part 1)
- Power Query Editor - Merge Queries (Part 2)
- Power BI - Develop Star Schema
- Data Modeling Concepts
- Power BI - Data Modeling
- Power BI - Manage Relationships
- Power BI - Cardinality
- Power BI - Dashboard Options
- Power BI Report Visualizations
- Power BI - Visualization Options
- Power BI - Visualization Charts
- Power BI - Stacked Bar Chart
- Power BI - Stacked Column Chart
- Power BI - Clustered Chart
- Power BI - 100% Stacked Chart
- Power BI - Area Chart and Stacked Area Chart
- Power BI - Line and Stacked Column Chart
- Power BI - Line and Clustered Column Chart
- Power BI - Ribbon Chart
- Power BI - Table and Matrix Visuals
- Power BI Map Visualizations
- Power BI - Creating Map Visualizations
- Power BI - ArcGIS Map
- Power BI Miscellaneous
- Power BI - Waterfall Charts
- Funnel Charts and Radial Gauge Chart
- Power BI - Scatter Chart
- Power BI - Pie Chart and Donut Chart
- Power BI - Card and Slicer Visualization
- Power BI - KPI Visual
- Power BI - Smart Narrative Visual
- Power BI - Decomposition Tree
- Power BI - Paginated Report
- Power BI - Python Script & R Script
- Power BI - Multi-row Card
- Power BI - Power Apps & Power Automate
- Power BI - Excel Integration
- Power BI Dashboard
- Power BI - Sharing Dashboards
- Power BI Sales Production Dashboard
- Power BI - HR Analytics Dashboard
- Power BI - Customer Analytics Dashborad
- Power BI - DAX Basics
- Power BI - Administration Role
- Power BI - DAX Functions
- Power BI - DAX Text Functions
- Power BI - DAX Date Functions
- Power BI - DAX Logical Functions
- Power BI - DAX Counting Functions
- Power BI - Depreciation Functions
- Power BI - DAX Information Functions
Power BI - DAX Counting Functions
In this chapter, various types of DAX counting functions are carried out.
Steps to Execute the DAX Counting Functions
- First, you need to import the dataset to the Power BI desktop.
- Select the "New measure" from the "Table tools" tab and specify the valid expression for every counting function in the formula bar.
- Navigate to the Report View and you may choose any of the Table, Matrix, and Scorecard visuals and click on the new measure from the Data pane to view the computed result.
Dataset − You need to download the Employee dataset "D:\Employee12.xlsx" and load it in the BI desktop to imply these functions.
Types of DAX Counting Functions
Now, let's discuss the various types of DAX Counting Functions.
DISTINCTCOUNT Function
It will calculate the number of distinct field values in a field. The null value will also be countable.
Example − Write the expression in the formula bar.
n1 = DISTINCTCOUNT('Electronic company'[Name] )
Here, n1 is the name of the new measure and Name is the column of the Electronic company table.
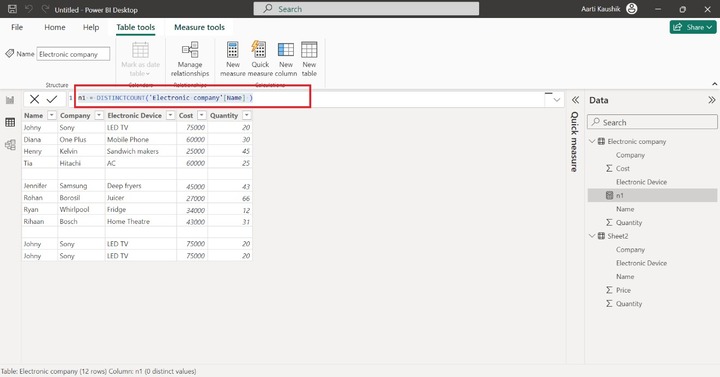
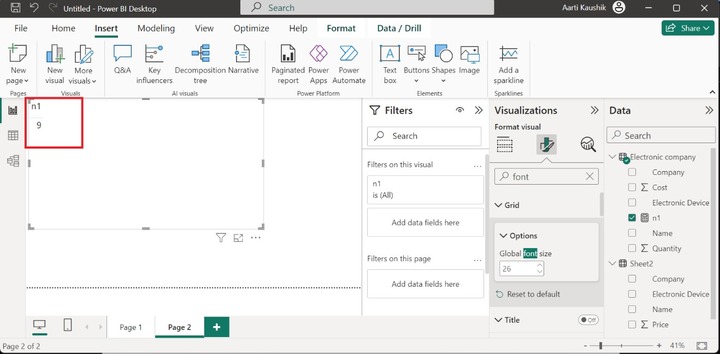
Therefore, the number of distinct names is 9.
DISTINCTCOUNTNOBLANK Function
It is similar to the DISTINCTCOUNT function except the null values are not countable in this function.
Example − Enter the expression in the formula bar:
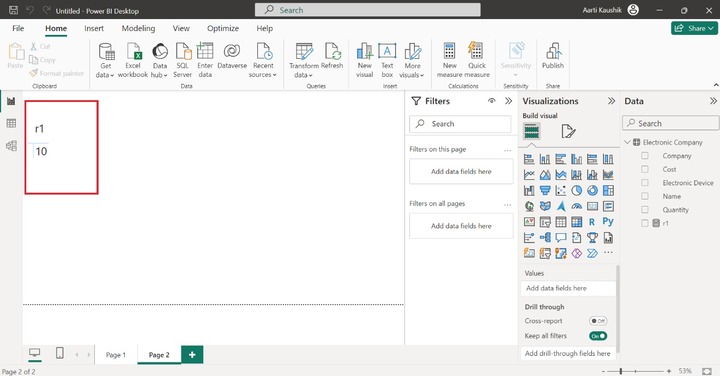
r1 = DISTINCTCOUNTNOBLANK('Electronic Company'[Quantity])
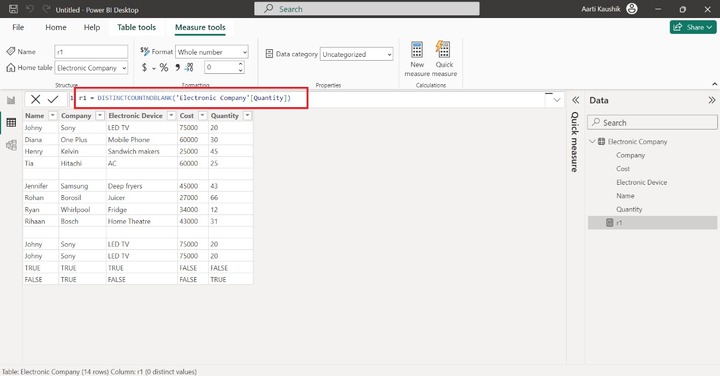
The computed result is shown in the Report View:
COUNT Function
It comprises only one parameter which is the field name and the text, dates and numeric values are countable by this function. The null values are ignored.
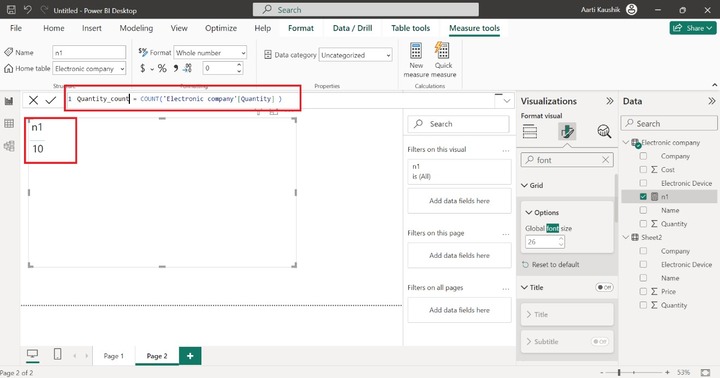
Scenario 1 − The below expression will retrieve the total number of entries in the quantity column excluding the null values.
Quantity_count = COUNT('Electronic company'[Quantity] )
In the given formula, Quantity_count is the new measure name and Quantity indicates the column name in the Electronic company table.
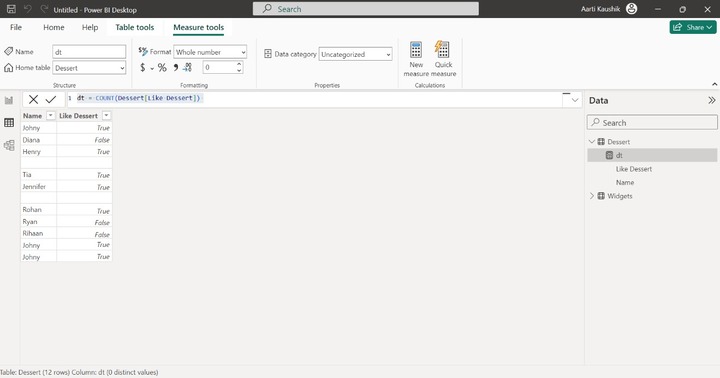
Scenario 2 − In this case, will the Count function perform or not if the field values contain only True and False entries.
Let's try the COUNT formula:
dt = COUNT(Dessert[Like Dessert])
Here Like Dessert specify the column in the Dessert table.
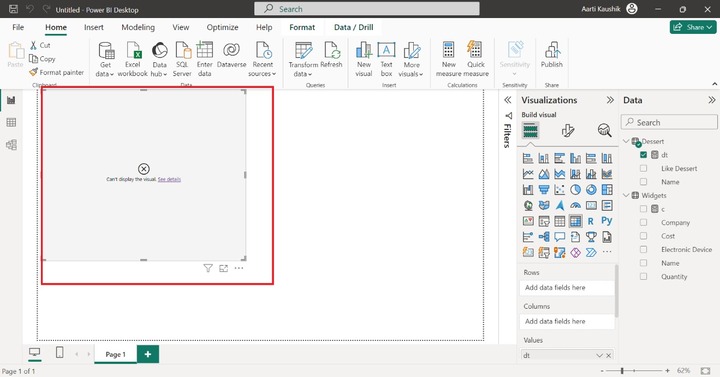
As you can see in the screenshot, no output is displayed as the Count function doesnt work for True and False values. To overcome this problem, you can execute the COUNTA function which is explained in the next section.
COUNTA Function
It is similar to the Count function except that True and False values will also be countable.
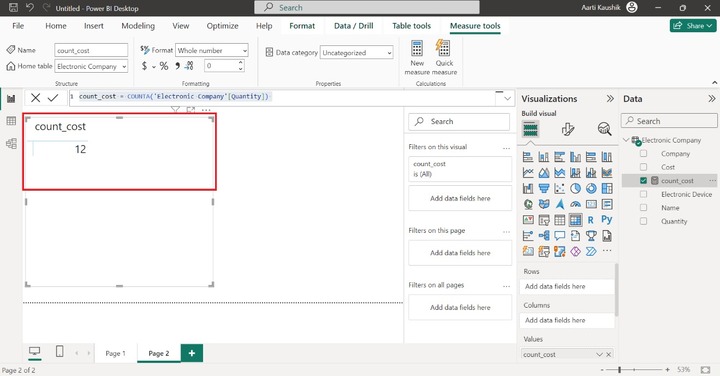
Example 1 − You may write the given expression in the formula bar and commit the formula.
count_cost = COUNTA('Electronic Company'[Quantity])
Here, count_cost is the new measure name, and quantity indicates the column name.
You may switch to the report view and select the count_cost from the Data pane to view the computed result.
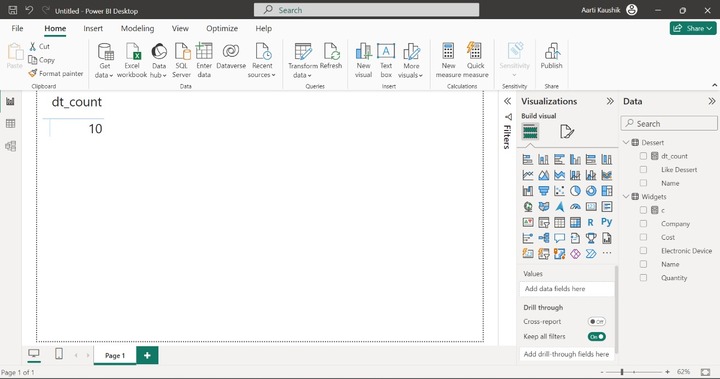
Example 2 − Let’s try this function for boolean values −
dt_count = COUNTA(Dessert[Like Dessert])
In the given formula, dt_count is the new measure name, and Like Dessert is the column of the Dessert table.
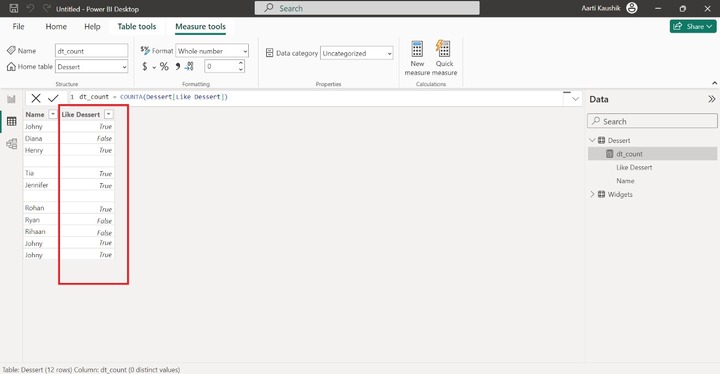
Yes, it works for Boolean entries and the output is displayed on the screenshot.
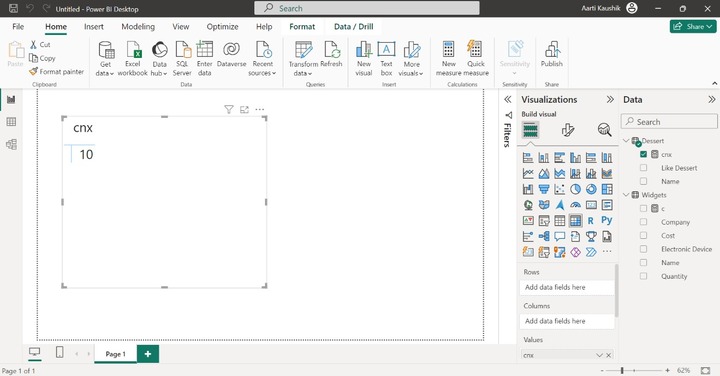
COUNTX Function
Like the Count function, True and False entries in the field are not evaluated. Two parameters are defined in the COUNTX function. You need to specify the table name in the first parameter and write the column name/valid expression in the second parameter.
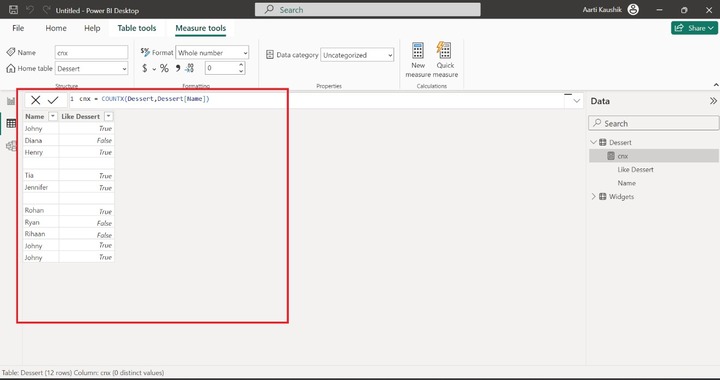
For example −
cnx = COUNTX(Dessert, Dessert[Name])
Here Dessert is the table name and Name is the column in this table. Now, click on the Report view and choose the cnx measure from the Data pane. After implementing the expression, the total number of entries of the Name column will be retrieved excluding null values.
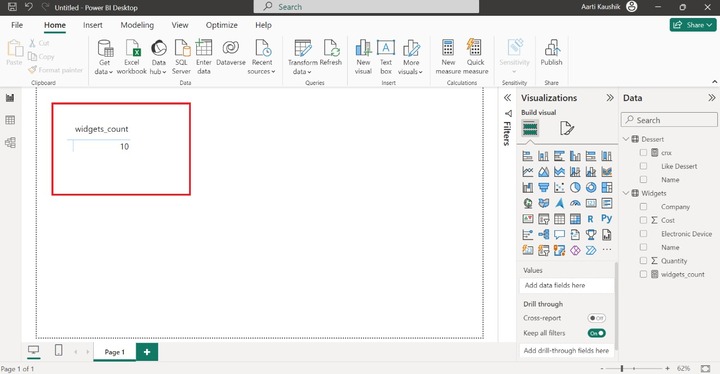
COUNTAX Function
COUNTAX function works with all data types like boolean values, numeric values, and string values. It also contains two parameters where the first parameter represents the table name, and the second parameter indicates the expression or column name.
Example − Enter the expression in the formula bar −
widgets_count = COUNTAX(Widgets,Widgets[Cost])
Now, you can move to the Report view, and click on the widgets_count measure from the Data pane to view the result.
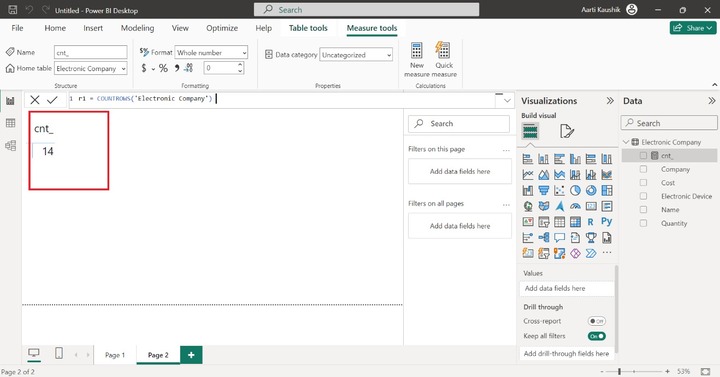
COUNTROWS Function
The total rows that are defined in the loaded dataset are countable by this function.
Example − Write the following expression in the formula bar −
r1 = COUNTROWS('Electronic Company')
Here, r1 is the name of the measure, and Electronic Company indicates the table name.
As you can notice in the screenshot, the total number of rows in the Electronic Company table that are 14 will be populated on the screen.
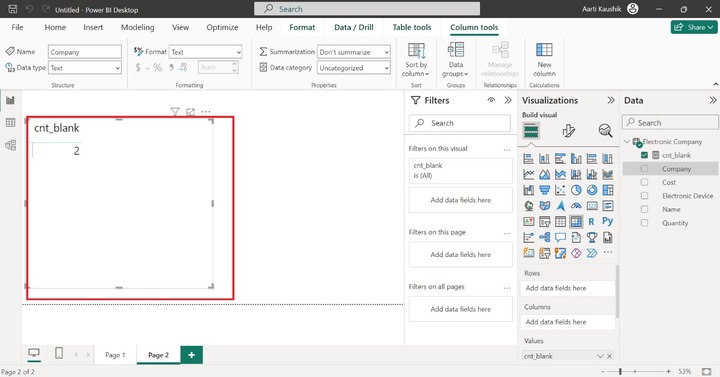
COUNTBLANK Function
It is another variant of the count function and is used to count only null values presented in the specified column.
Example − Write the following expression in the formula bar −
cnt_blank = COUNTBLANK('Electronic Company'[Cost])
Here, cnt_blank specifies the measure name and Cost is the column/field name of the Electronic Company table.
Now, you may navigate to the Report view and select the cnt_blank measure to get the result. Therefore, the number of null values is 2 in the Cost column.