- Power BI - Home
- Power BI - Introduction
- Power BI - Installation Steps
- Power BI - Architecture
- Power BI Desktop
- Power BI - Desktop
- Power BI - Desktop Window
- Power BI Service
- Power BI - Window Supported Browsers
- Power BI - Generating Reports
- Power BI Desktop Service
- Power BI - Desktop vs Service
- Power BI - Supported Data Sources
- Power BI - Comparison Tools
- Power Query Editor
- Power Query Editor - Introduction
- Power Query Editor - Data Discrepancy
- Power Query Editor - Merge Queries (Part 1)
- Power Query Editor - Merge Queries (Part 2)
- Power BI - Develop Star Schema
- Data Modeling Concepts
- Power BI - Data Modeling
- Power BI - Manage Relationships
- Power BI - Cardinality
- Power BI - Dashboard Options
- Power BI Report Visualizations
- Power BI - Visualization Options
- Power BI - Visualization Charts
- Power BI - Stacked Bar Chart
- Power BI - Stacked Column Chart
- Power BI - Clustered Chart
- Power BI - 100% Stacked Chart
- Power BI - Area Chart and Stacked Area Chart
- Power BI - Line and Stacked Column Chart
- Power BI - Line and Clustered Column Chart
- Power BI - Ribbon Chart
- Power BI - Table and Matrix Visuals
- Power BI Map Visualizations
- Power BI - Creating Map Visualizations
- Power BI - ArcGIS Map
- Power BI Miscellaneous
- Power BI - Waterfall Charts
- Funnel Charts and Radial Gauge Chart
- Power BI - Scatter Chart
- Power BI - Pie Chart and Donut Chart
- Power BI - Card and Slicer Visualization
- Power BI - KPI Visual
- Power BI - Smart Narrative Visual
- Power BI - Decomposition Tree
- Power BI - Paginated Report
- Power BI - Python Script & R Script
- Power BI - Multi-row Card
- Power BI - Power Apps & Power Automate
- Power BI - Excel Integration
- Power BI Dashboard
- Power BI - Sharing Dashboards
- Power BI Sales Production Dashboard
- Power BI - HR Analytics Dashboard
- Power BI - Customer Analytics Dashborad
- Power BI - DAX Basics
- Power BI - Administration Role
- Power BI - DAX Functions
- Power BI - DAX Text Functions
- Power BI - DAX Date Functions
- Power BI - DAX Logical Functions
- Power BI - DAX Counting Functions
- Power BI - Depreciation Functions
- Power BI - DAX Information Functions
Power BI - DAX Text Functions
DAX Text functions can seamlessly work with new measures, calculated columns, and tables. With DAX Text functions, you can manipulate the text data and enable the formatting of the specific text, retrieve the split part of the text, combine two strings, find the specific text in a string, and so on.
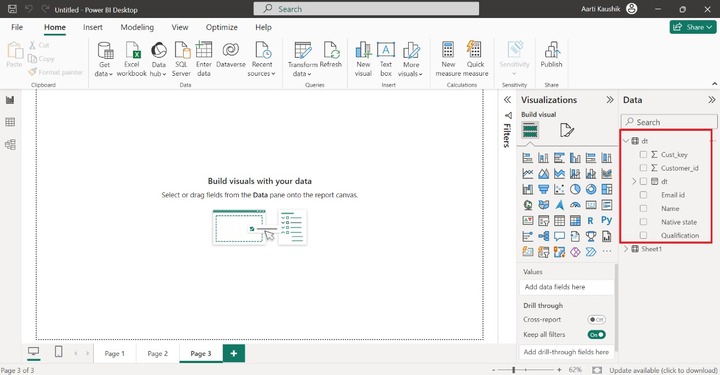
Dataset − You need to import the dataset "D:\date.xlsx" in the BI desktop. It comprises seven fields, Cust_key, Customer_id, dt, Email id, Name, Native state, and Qualification.
Main Power BI DAX Text Functions
Here is a list of all the main Power BI DAX text functions −
- LEFT() function
- RIGHT() function
- UPPER() function
- LOWER() function
- FORMAT() function
- FIND() function
- BLANK() function
- LEN() function
- CONCATENATE() function
- CONCATENATEX() function
- MID() function
- TRIM() function
- REPLACE() function
- EXACT() function
- SUBSTITUTE() function
LEFT Function
Retrieval of characters is done from the left side of the designated string.
Example − You may click on the "New measure" and enter the expression in the formula bar.
m=left("Subscription, 4")
Now, you may commit the formula.
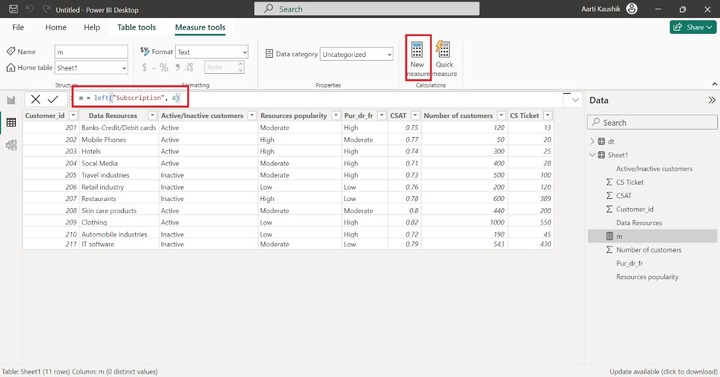
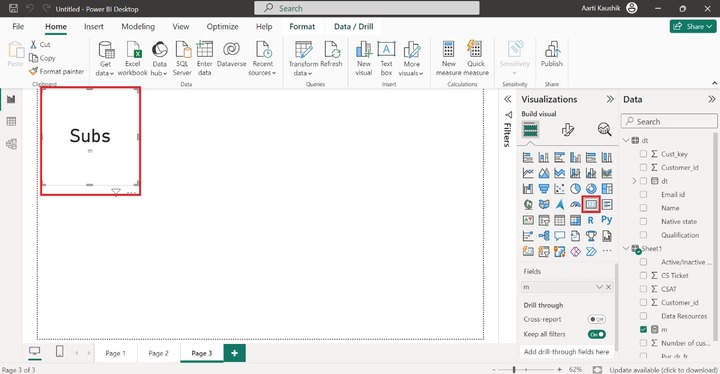
Now, you can navigate to the "Report View" and choose the "Card" visual to get the portion of the defined string.
RIGHT Function
It is just opposite to the LEFT function. A certain number of characters will be retrieved from the defined String's right part.
Example − Write the expression −
m=right("clothing", 5)
Here, the m is the name of the measure.
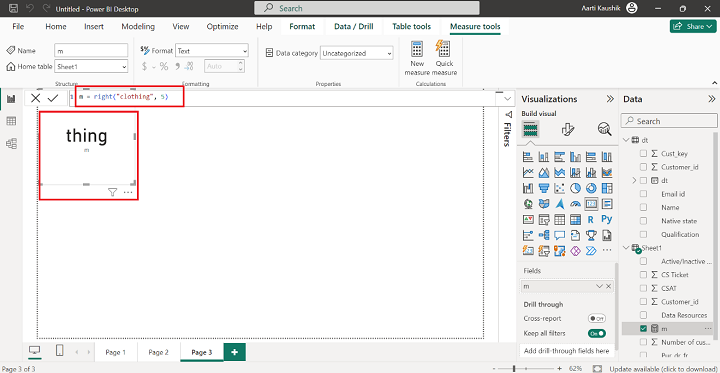
Therefore, the portion of the string "thing" is fetched through the DAX right() function.
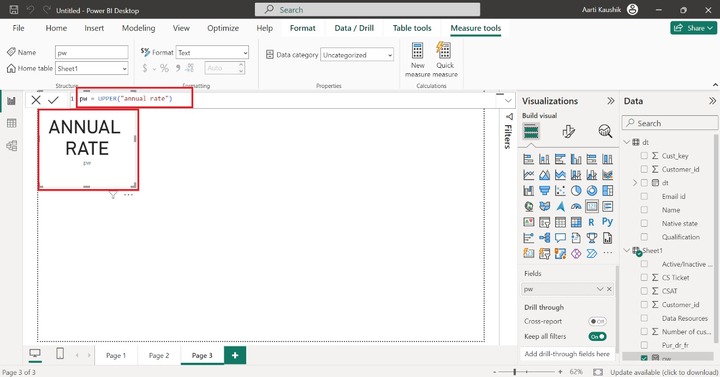
UPPER() Function
It transforms the complete string into the upper case.
Example − You may write the expression −
pw=UPPER("annual rate")
Here, pw is the name of the measure, and the first argument is text that would be converted into upper case.
LOWER() DAX Function
It converts the defined string into the lowercase.
Example − You may enter the DAX expression in the formula bar.
le = LOWER("PARTITION")
In the formula, the "PARTITION" denotes the string.
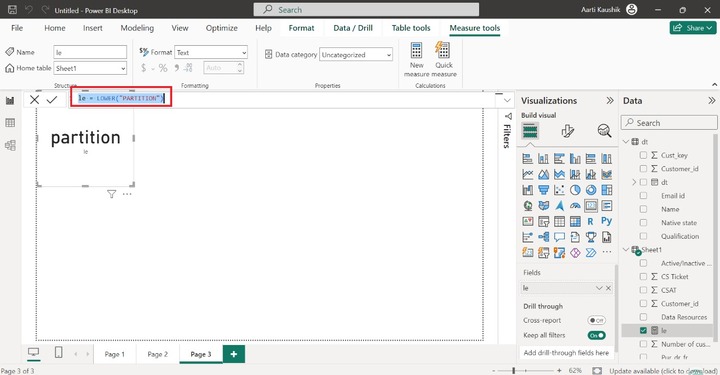
Therefore, the computed result of the new measure "le" is showcased through the Card(new) visual.
FORMAT() Function
It transforms the specified field values into the designated format. The empty text is retrieved if the field values inside the Format function is blank.
Example − You can click on the "New column" from the "Column Tools" tab.
You may enter the expression in the formula bar and then press "Enter" −
fw = FORMAT(Sheet1[CSAT],"Percent")
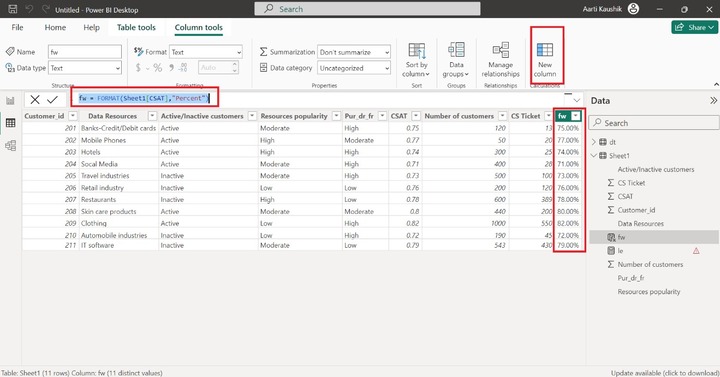
Therefore, all the field values of the CSAT column are transformed into the Percentage format.
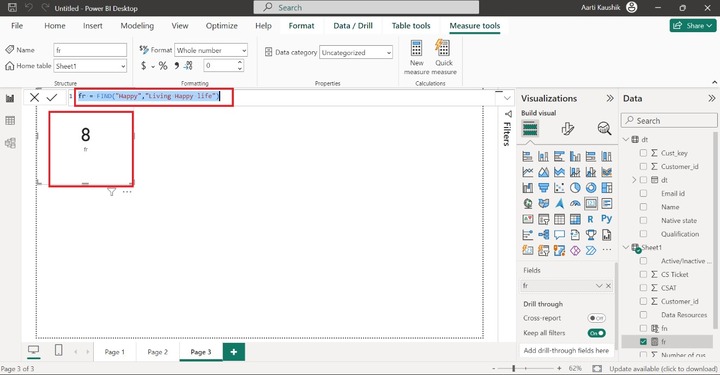
Find() Function
It retrieves the index number of the searched string in another string.
Example − You may write the expression for the new measure −
fr = FIND("Happy","Living Happy life")
The first parameter specifies the string "Happy" that needs to be searched in the second parameter "Living Happy Life".
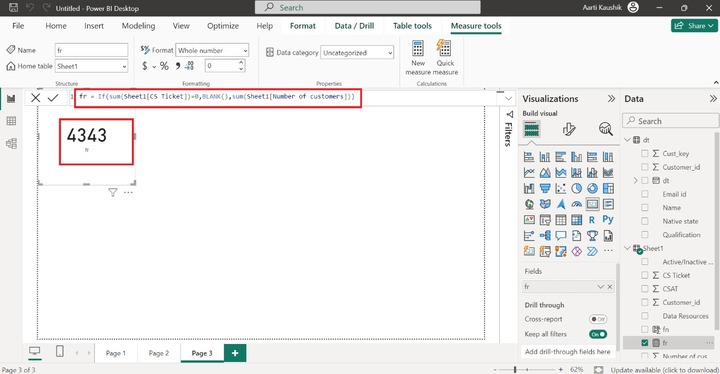
Blank Function
It retrieves the blank if the specific condition is correct. It is usually combined with others conditional functions.
Example − You can write the expression in the formula bar −
fr = If(sum(Sheet1[CS Ticket])=0,BLANK(),sum(Sheet1[Number of customers]))
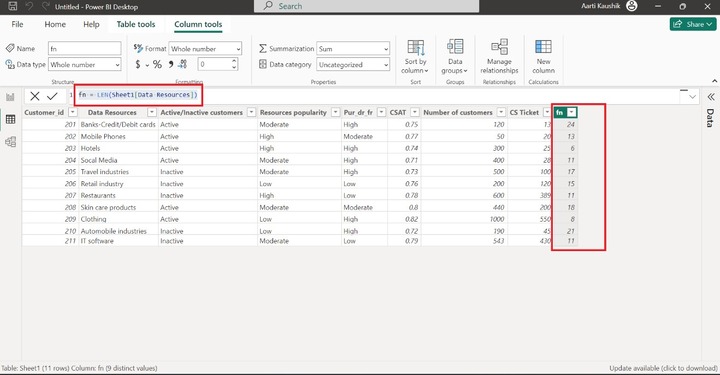
LEN() Function
It retrieves the total number of characters presented in the defined string.
Example − You may enter the DAX len function expression in the formula bar −
fn = LEN(Sheet1[Data Resources])
And then commit the formula to get the result.
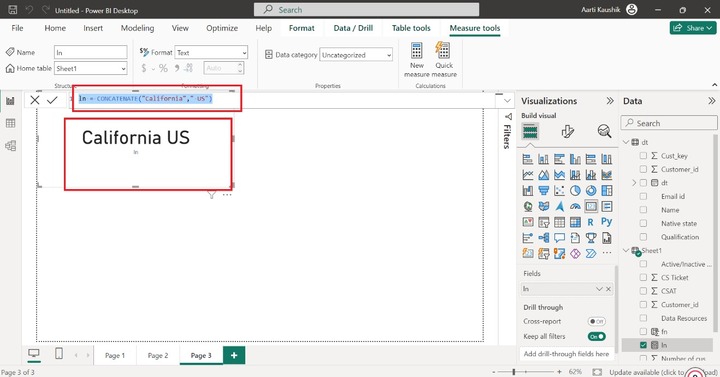
CONCATENATE() Function
It is used to combine the two strings.
Example − You may write the DAX expression in the formula bar −
ln = CONCATENATE("California"," US")
And then press "Enter" to get the result.
CONCATENATEX() Function
The CONCATENATE () merges all the field values of the specified column which is separated by the delimiter for every rows of the table.
Example − You can write the following formula in the formula bar and press "Enter".
fn = CONCATENATEX(Sheet1, Sheet1[Data Resources]," ")
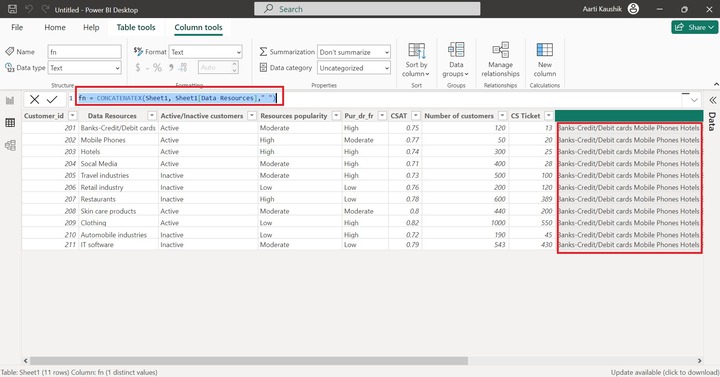
As you can observe in the snapshots, all the values of the Data resources are combined and separated by the single space delimiter and combined strings are showcased in every row of the "fn" column.
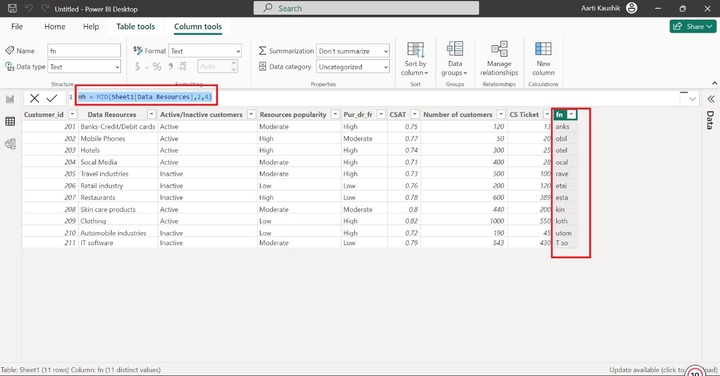
MID() Function
It consist of the three parameters that specify the defined text, the start position, number of the characters that need to extract from the defined text.
Example − You may enter the expression and press Enter −
nh = MID(Sheet1[Data Resources],2,4)
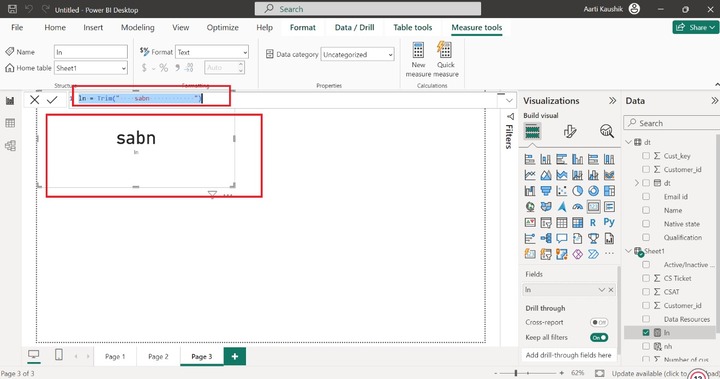
TRIM() Function
It is used to eliminate the unnecessary spaces presented in the field values.
Example − You may write the formula −
ln = Trim("sabn")
Here, the all the unnecessary spaces is eliminated from left and right side of the string.
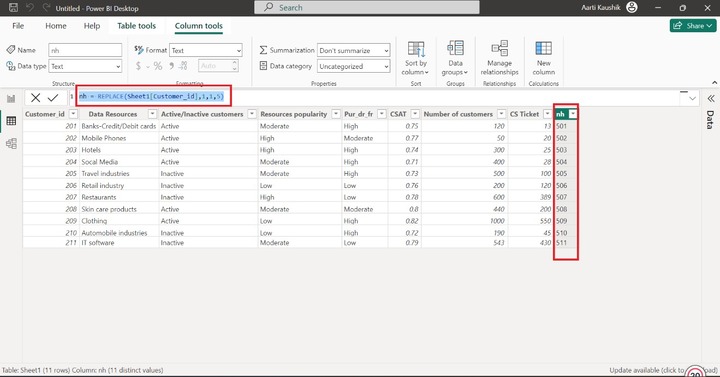
REPLACE() Function
Replace() function comprises of four parameters that is String1/Column, index position, no. of characters that needs to be replaced, another string)
Example − You may enter the expression in the formula bar
nh = REPLACE(Sheet1[Customer_id],1,1,5)
Here, the first arguments show the column "Customer_id" and the second argument shows the index number, and third argument shows only 1 number will interchange, the new text is 5.
EXACT() Function
It retrieves the Boolean values and used to compare two strings. If both are not same, then False will return and vice versa.
Example − You may enter the expression in the formula bar −
ln = Exact("Energetic", "Hectic")
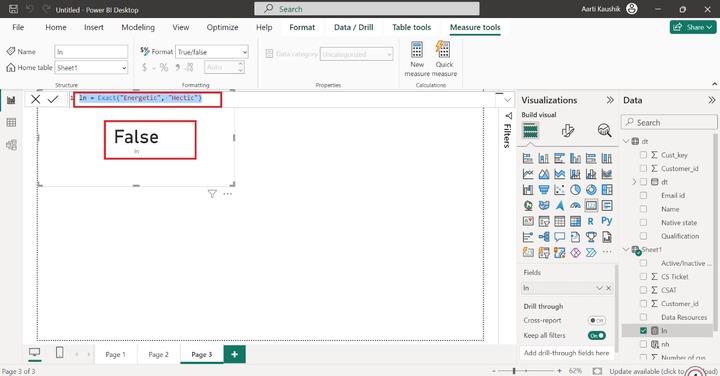
As you can notice in the snapshot, the two strings are not exact so False value will retrieve.
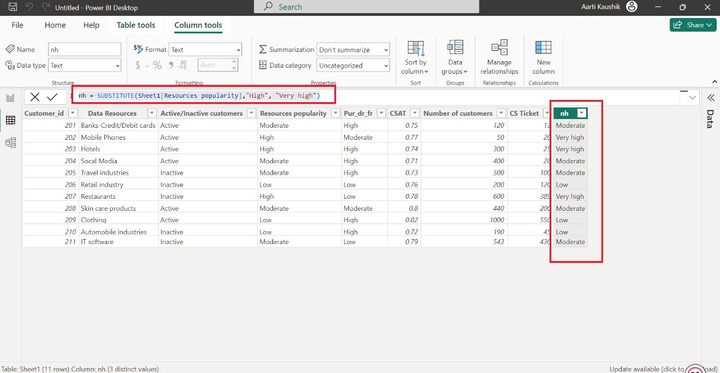
SUBSTITUTE() Function
It is used to interchange the string value with another string.
Example − You can enter the expression in the formula bar −
nh = SUBSTITUTE(Sheet1[Resources popularity],"High", "Very high")
Here, the high value is replaced with the "Very high" value in the Resources popularity.