- Power BI - Home
- Power BI - Introduction
- Power BI - Installation Steps
- Power BI - Architecture
- Power BI Desktop
- Power BI - Desktop
- Power BI - Desktop Window
- Power BI Service
- Power BI - Window Supported Browsers
- Power BI - Generating Reports
- Power BI Desktop Service
- Power BI - Desktop vs Service
- Power BI - Supported Data Sources
- Power BI - Comparison Tools
- Power Query Editor
- Power Query Editor - Introduction
- Power Query Editor - Data Discrepancy
- Power Query Editor - Merge Queries (Part 1)
- Power Query Editor - Merge Queries (Part 2)
- Power BI - Develop Star Schema
- Data Modeling Concepts
- Power BI - Data Modeling
- Power BI - Manage Relationships
- Power BI - Cardinality
- Power BI - Dashboard Options
- Power BI Report Visualizations
- Power BI - Visualization Options
- Power BI - Visualization Charts
- Power BI - Stacked Bar Chart
- Power BI - Stacked Column Chart
- Power BI - Clustered Chart
- Power BI - 100% Stacked Chart
- Power BI - Area Chart and Stacked Area Chart
- Power BI - Line and Stacked Column Chart
- Power BI - Line and Clustered Column Chart
- Power BI - Ribbon Chart
- Power BI - Table and Matrix Visuals
- Power BI Map Visualizations
- Power BI - Creating Map Visualizations
- Power BI - ArcGIS Map
- Power BI Miscellaneous
- Power BI - Waterfall Charts
- Funnel Charts and Radial Gauge Chart
- Power BI - Scatter Chart
- Power BI - Pie Chart and Donut Chart
- Power BI - Card and Slicer Visualization
- Power BI - KPI Visual
- Power BI - Smart Narrative Visual
- Power BI - Decomposition Tree
- Power BI - Paginated Report
- Power BI - Python Script & R Script
- Power BI - Multi-row Card
- Power BI - Power Apps & Power Automate
- Power BI - Excel Integration
- Power BI Dashboard
- Power BI - Sharing Dashboards
- Power BI Sales Production Dashboard
- Power BI - HR Analytics Dashboard
- Power BI - Customer Analytics Dashborad
- Power BI - DAX Basics
- Power BI - Administration Role
- Power BI - DAX Functions
- Power BI - DAX Text Functions
- Power BI - DAX Date Functions
- Power BI - DAX Logical Functions
- Power BI - DAX Counting Functions
- Power BI - Depreciation Functions
- Power BI - DAX Information Functions
Power BI - Desktop
What is a Power BI Desktop?
Power BI Desktop is a window application of the Power BI suite that allows you to inspect and aggregate data from various sources into one canvas. It is free to download and permits users to generate stunning reports and dashboards.
Features of Power BI Desktop
- It loads and retrieves datasets from numerous data sources like XML, Azure, Sharepoint, Excel, Dataverse, etc.
- It also extracts data from multiple databases, like SQL servers, IBM DB2 databases, PostgreSQL databases, Teradata, and so on.
- The powerful component Power Query Editor is being used by the Power BI desktop to transform tables containing millions of rows of data.
- Data models and schemas are effectively constructed to understand operational business data.
Why Choose Power BI Desktop?
Usually, beginners get confused between Power BI desktop and Power BI services. The following are the reasons to go for a Power BI desktop.
- Data modelling and preparing data − It is a precise tool when you need to get data, rectify data anomalies, and connect the data from distinct sources. You may construct the star schema, identify the relationship between tables, and customize the model.
- Development of Report − A wide variety of visuals, like pie charts, maps, matrix, and many more, are built to create the report. If you wish to customize the report's formatting, styling, layout, and background visual color then the Power BI desktop would be the best companion.
- Not for online work − An Internet connection is not required while developing the report and dashboard on the Power BI desktop.
- Sharing of files − Users can upload files that have an extension (.pbix) with others and send these files to the Power BI service.
- Advanced Complicated Calculation − The enriched environment of the Power BI Desktop allows users to develop and debug these non-simple calculations. It facilitates the user's ability to solve complex calculations by using DAX formulas and creating new measures.
Multiple Views in Power BI Desktop
The three views Report View, Data View, and Model View have different icons available for users.
Report View
You may add several pages while working on Report View. The bottom line shows three pages and if you are willing to add more pages then click on the + sign. A report must have a minimum single page where frequent visualization of data is achievable by selecting the fields onto the canvas.
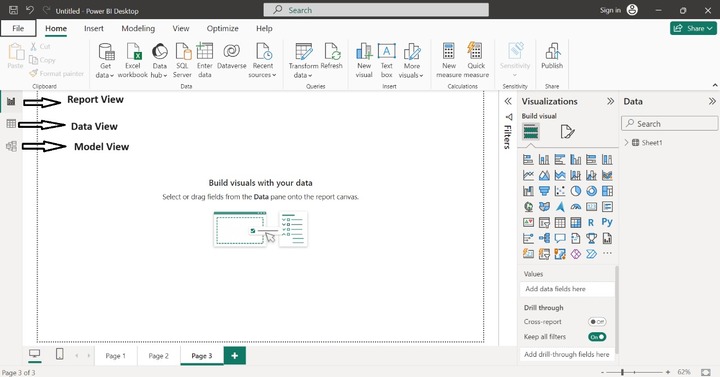
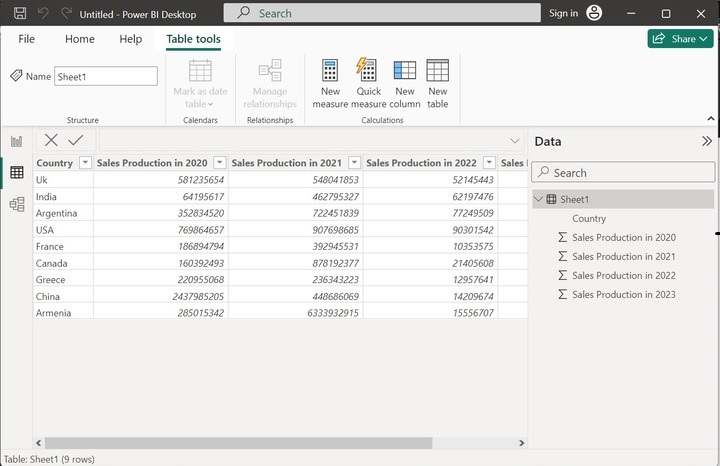
Data View
You can traverse, delve into data, and recognize the data structure in the Data View. The simplest way is to load the data first into this tool and then select the Data View icon to inspect the table. Data manipulation like new measures, formatting, summarization, altering data types, and modifying field names can be employed in the Data View. Sorting and Number filters can also be applied to individual fields of the table.
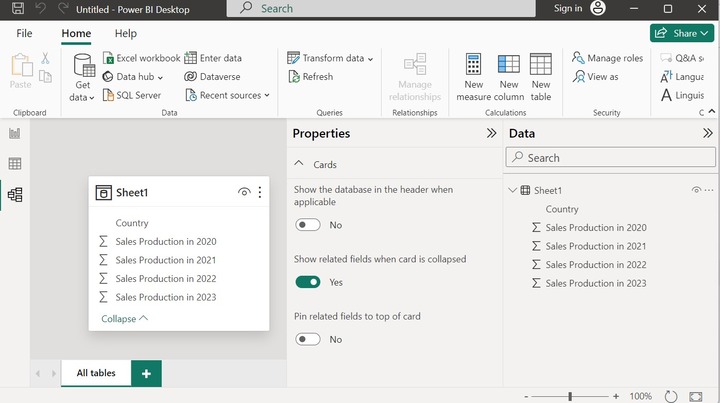
Model View
You can view the relationship between tables, measures, and columns. The simple data model is understandable and easily refreshed by the users. On the other hand, the complex data model is difficult to construct and generalize. It would be recommended to develop the more complicated relationships using the Power query editor to filter the data and reshape the existing model.
Case Study
Richard wishes to load the Sale.xlsx worksheet and hide the worksheet in the Report View. In this case, he has to select the Excel workbook and open the file name.
Importing Data
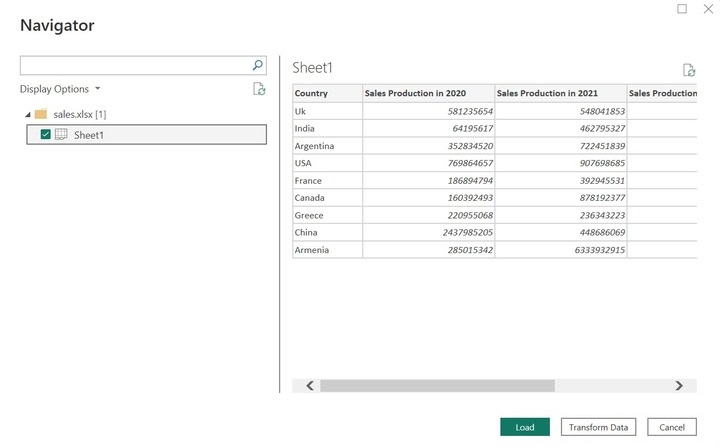
To extract the data, Richard needs to click on the Get Data tile and list of common data sources like Excel workbook, Power BI semantic models, Dataflows, Dataverse, SQL Server, Analysis Services, Text/CSV, Web, OData feed, Blank query are available to retrieve the dataset. He may select any of these types to load the data.
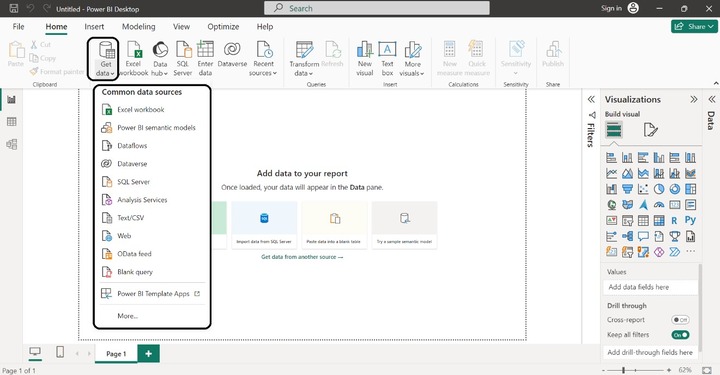
Richard selects the Excel workbook sources and he has two options either Load or Transform data. Usually, Query Editor would be employed to transform and cleanse the data. We will learn about transforming data in detail in the Power Query Editor chapter. Richard decided to click on the Load and the entire worksheet was imported into the Power BI desktop.
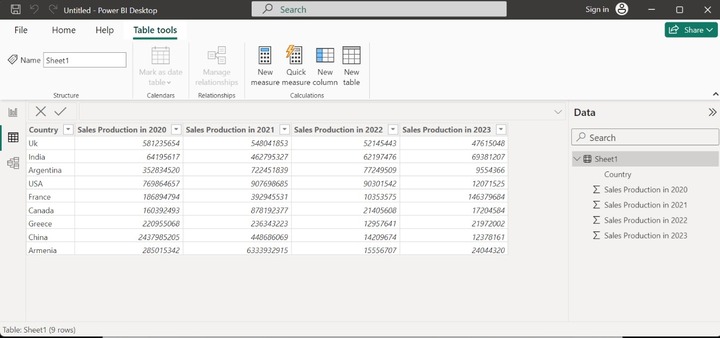
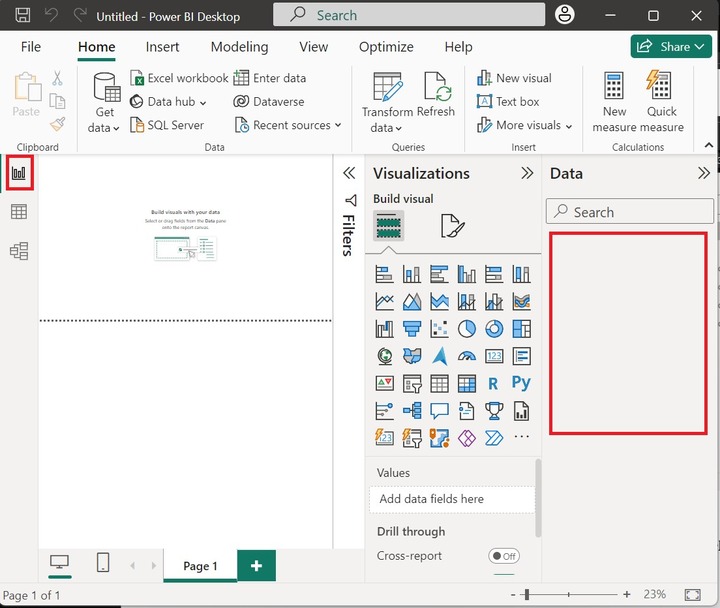
The Data pane indicates the table created in MS Excel data source.
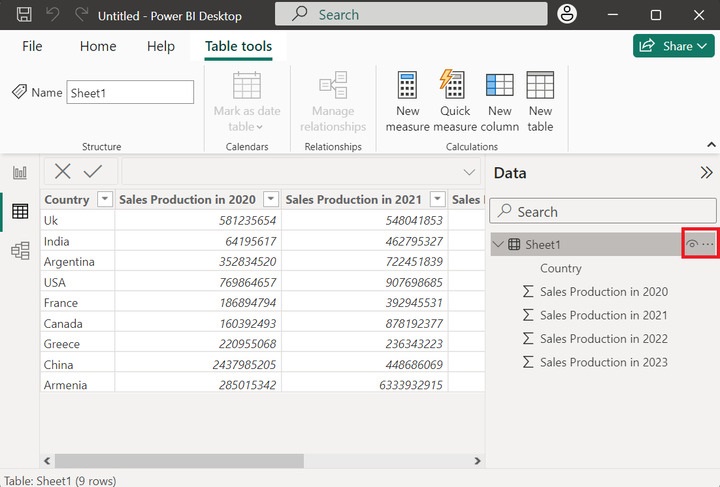
Richard is new in Power BI and unaware of how to build the visual for this table, he just intends to hide this table in the Report View. To do this, he clicked on the More options in the Data pane.
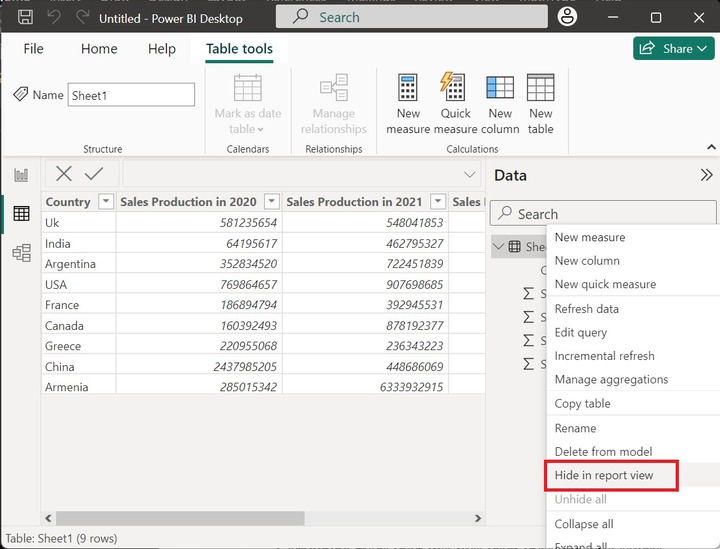
Once he selected the option "Hide in Report View" the table was not displayed in the Report View. The Data pane section shows the empty area.
FAQs on Power BI Desktop
Here are some common questions about Power BI Desktop, a free and powerful tool by Microsoft for data analysis and visualization.
1. What is the data limit in the Power BI desktop?
It is one of the basic components of Power BI to construct the report. The data limit is 1GB. It is efficient for storing and manipulating small datasets. However, Power BI premium is used for giant datasets.
2. Are there any performance issues in the Power BI desktop?
Yes, there are performance issues like dragging so many visuals in one report leads to slowing down the rendering process and manipulation of data and generating complex schemas without a query editor. The Report's masterwork can be improved by using only the most important visuals where loading and extracting data takes less time.