- Power BI - Home
- Power BI - Introduction
- Power BI - Installation Steps
- Power BI - Architecture
- Power BI Desktop
- Power BI - Desktop
- Power BI - Desktop Window
- Power BI Service
- Power BI - Window Supported Browsers
- Power BI - Generating Reports
- Power BI Desktop Service
- Power BI - Desktop vs Service
- Power BI - Supported Data Sources
- Power BI - Comparison Tools
- Power Query Editor
- Power Query Editor - Introduction
- Power Query Editor - Data Discrepancy
- Power Query Editor - Merge Queries (Part 1)
- Power Query Editor - Merge Queries (Part 2)
- Power BI - Develop Star Schema
- Data Modeling Concepts
- Power BI - Data Modeling
- Power BI - Manage Relationships
- Power BI - Cardinality
- Power BI - Dashboard Options
- Power BI Report Visualizations
- Power BI - Visualization Options
- Power BI - Visualization Charts
- Power BI - Stacked Bar Chart
- Power BI - Stacked Column Chart
- Power BI - Clustered Chart
- Power BI - 100% Stacked Chart
- Power BI - Area Chart and Stacked Area Chart
- Power BI - Line and Stacked Column Chart
- Power BI - Line and Clustered Column Chart
- Power BI - Ribbon Chart
- Power BI - Table and Matrix Visuals
- Power BI Map Visualizations
- Power BI - Creating Map Visualizations
- Power BI - ArcGIS Map
- Power BI Miscellaneous
- Power BI - Waterfall Charts
- Funnel Charts and Radial Gauge Chart
- Power BI - Scatter Chart
- Power BI - Pie Chart and Donut Chart
- Power BI - Card and Slicer Visualization
- Power BI - KPI Visual
- Power BI - Smart Narrative Visual
- Power BI - Decomposition Tree
- Power BI - Paginated Report
- Power BI - Python Script & R Script
- Power BI - Multi-row Card
- Power BI - Power Apps & Power Automate
- Power BI - Excel Integration
- Power BI Dashboard
- Power BI - Sharing Dashboards
- Power BI Sales Production Dashboard
- Power BI - HR Analytics Dashboard
- Power BI - Customer Analytics Dashborad
- Power BI - DAX Basics
- Power BI - Administration Role
- Power BI - DAX Functions
- Power BI - DAX Text Functions
- Power BI - DAX Date Functions
- Power BI - DAX Logical Functions
- Power BI - DAX Counting Functions
- Power BI - Depreciation Functions
- Power BI - DAX Information Functions
Data Discrepancy and Reshaping Data
Determine Data Discrepancy
In the previous chapter, you have learned the data extraction and transformation of data in the Power Query Editor, now you can easily monitor the column quality, and column properties and investigate the data inconsistencies in the loaded dataset.
Case Study 1
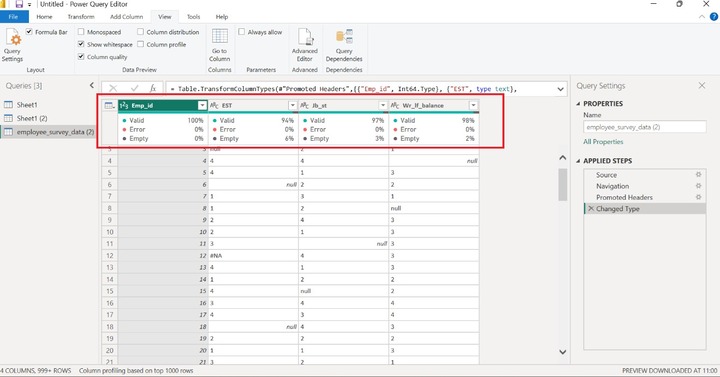
The first time, Richard loaded and transformed the dataset into Power Query Editor, he wished to see the quality of the sample dataset. To achieve this, he navigated to the View tab and clicked on "Column Quality" in the "Data Preview group".
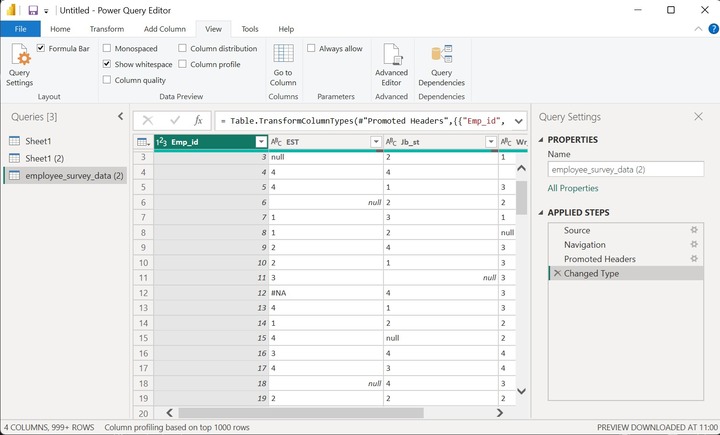
Now, Richard monitors the quality of every column. The first column Emp_id is valid as there is no Error and no empty data value. He can see that 0% error for all columns and 6% of the EST column is empty, JB_st contains a 3% null value and the last column shows a 2% null value.
Column Distribution
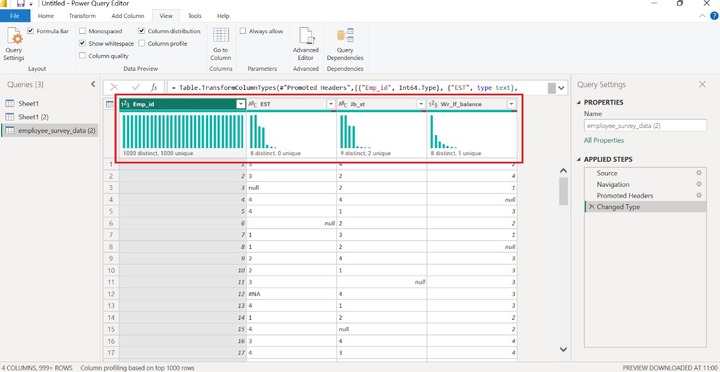
Now, Richard wants to know the distinct values and unique values of all columns which is achieved through the "Column Distribution". It is generally utilized in categorical data. Once he clicks on the "Column Distribution" checkbox, the bar chart is inserted into every column.
The screenshot depicts the value distribution of all columns. "Emp_id" has 1000 distinct and 1000 unique values. The "EST" column represents the 8 distinct values and 0 unique values. The third column "Jb_st" represents only 9 distinct and 2 unique values. The last column contains 8 distinct values and 1 unique value.
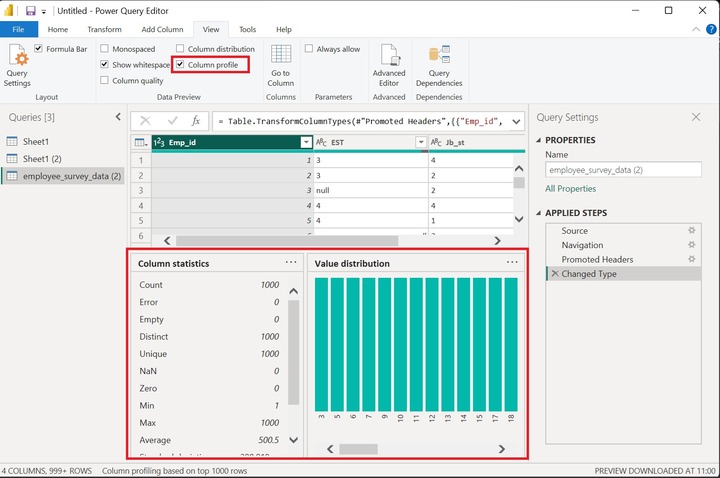
Column Profile
Richard wishes to see the column statistics of loaded datasets. He clicked on the "Column profile" presented in the "Data Preview". The screenshot shows the column statistics and value distribution of the Emp_id column. Now, he can see the total number of rows, the number of zeros, the standard deviation, and the average, min, and max values of the specified column. NaN(Not a number) value represents the non-numeric values.
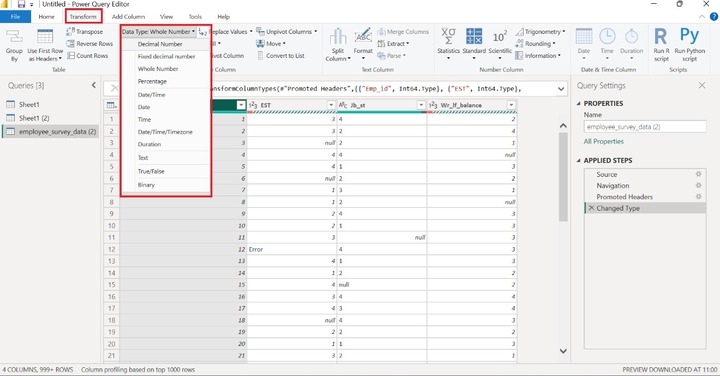
Change Column Data Type
Richard can also alter the data type of the column. First, he needs to click on the first column header and then switch to the Transform tab and select the "Fixed decimal number".
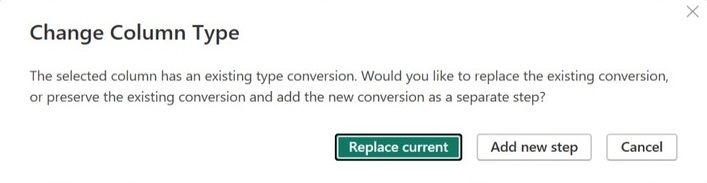
Click on the "Replace current".
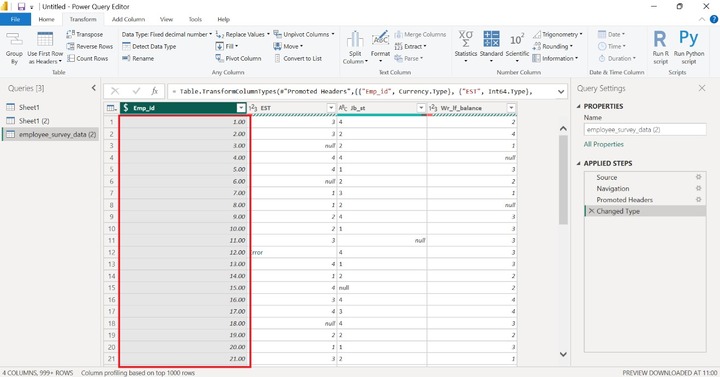
Now, he can see in the screenshot the datatype of the first column has been changed to the decimal number.
Alter Columns
There are various ways to modify columns −
- Reordering columns
- Removing columns
- Merging columns
- Removing duplicates
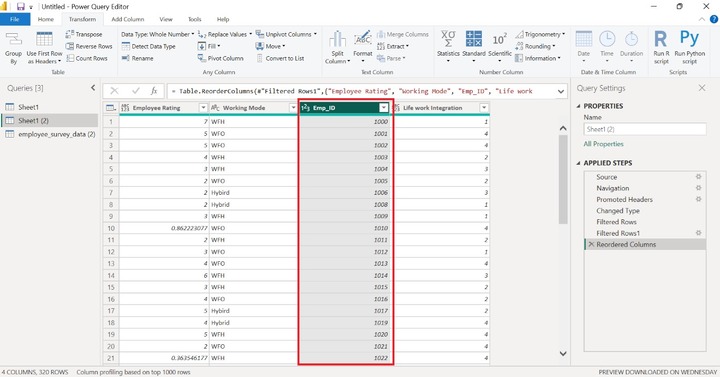
Reordering Columns − You may change the order of the columns by dragging the column and dropping it into the desired place.
For Example − Drag the "Emp_id" and place it into the fourth column. After that, the second and third columns moved to the preceding column. The screenshot shows that the columns have been rearranged, with the Emp_id becoming the third column.
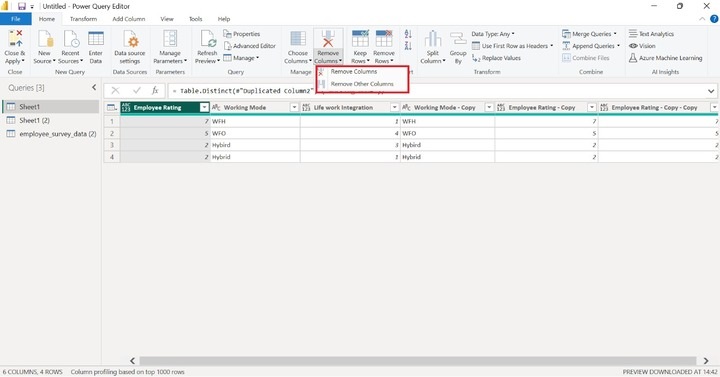
Removing Columns
You may eliminate either the selected column or other remaining columns. "Remove Columns" and "Remove other columns" are two options presented in the Manage Columns group in the Transform tab.
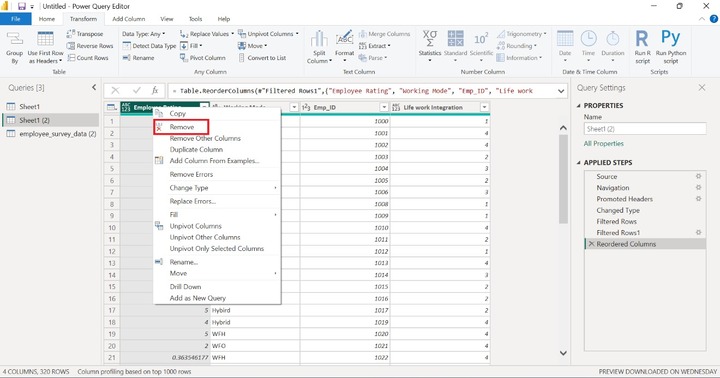
Another way is to right-click on the column header and select "Remove" from the drop-down menu.
For Example − In the given dataset, right-click on the first column "Employee Rating" and then click on "Remove".
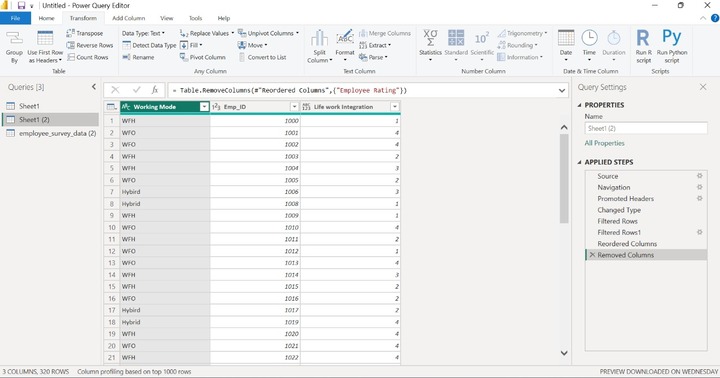
As you can notice in the screenshot, the "Employee Rating" column is deleted from the dataset.
Merging Columns
You can choose the Merge columns option to combine more than two columns.
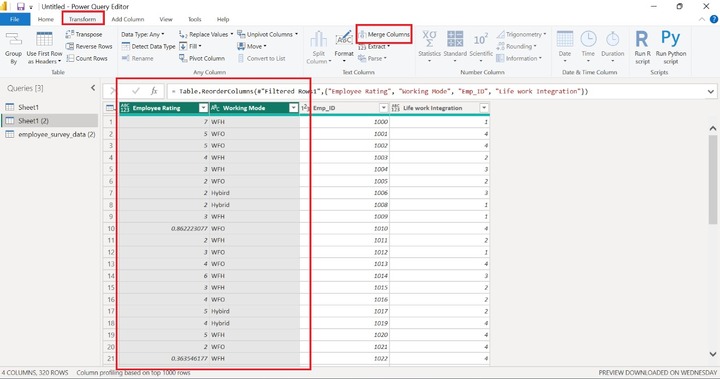
For Example − Suppose you wish to combine the "Employee Rating" and "Working Mode" columns into one column. Use "shift" + "right arrow" to select the first two columns and then navigate to the "Transform" tab and choose the "Merge Columns".
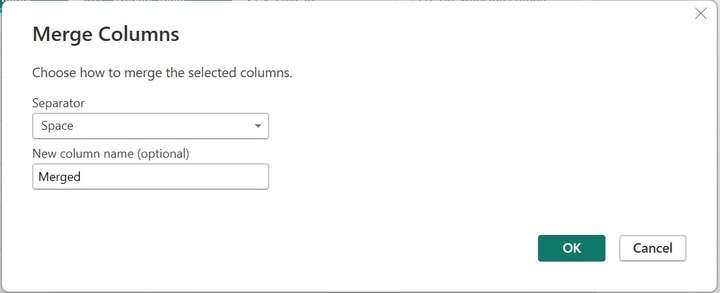
In the Merge Columns window, choose "Space" from the drop-down menu of the Separator which means data values of the two columns are separated through a space delimiter. You may also specify the name of the new column which is optional. Click OK.
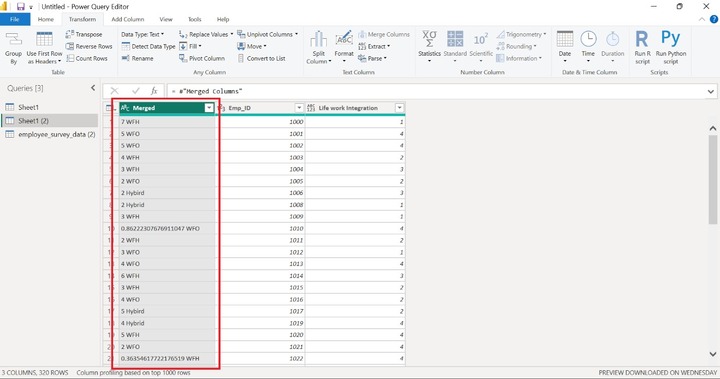
Therefore, selected columns are aggregated into one column "Merged".
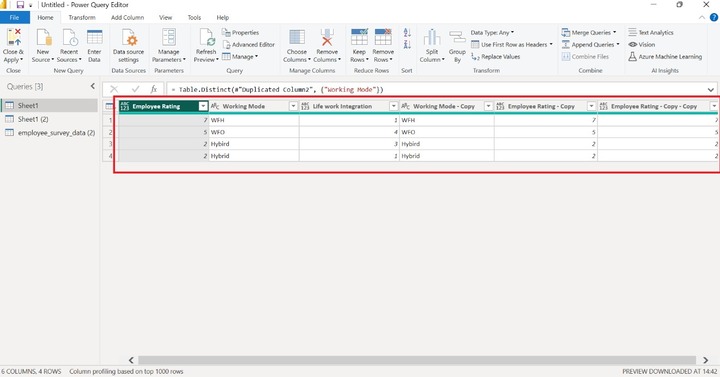
Removing Duplicates
You can eliminate duplicate records from the given dataset.
For Example − Suppose you want to delete duplicate records from the dataset, just right-click on any of the column headers like "Working Mode" and then click on "Remove Duplicates".
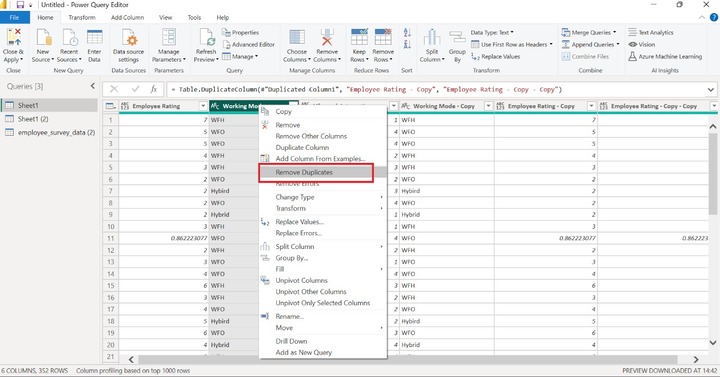
Therefore, all the duplicate records have been removed.
Sorting the Column Data
You may sort the data either in ascending or descending order to get to know about the dataset. You can click on the column header down arrow and choose either the "Sort Ascending or Sort Descending" option from the list.
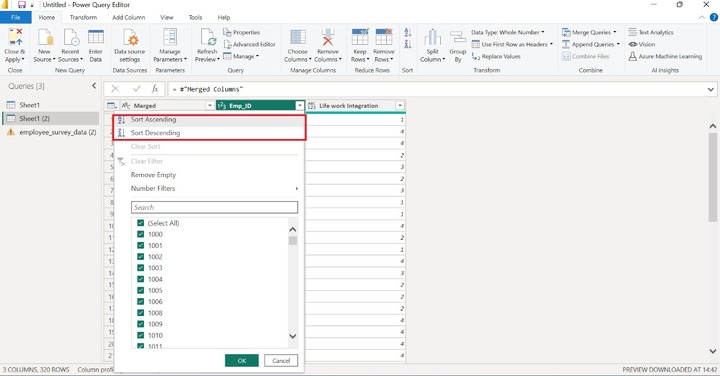
For Example − Expand the Emp_ID down arrow, select "Sort Descending" and click OK.
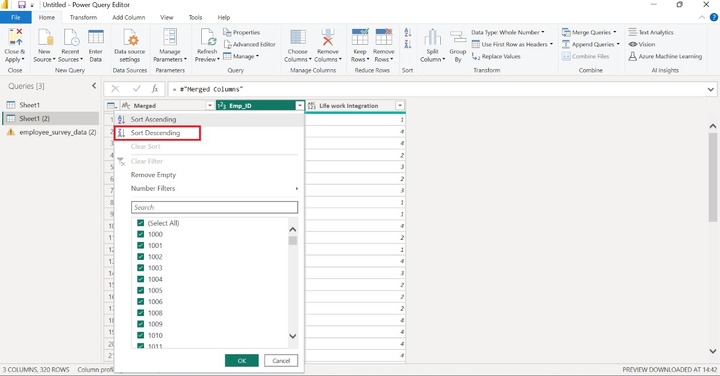
Therefore, the data in the Emp_id is sorted in descending order.

Filtering
You can filter the columnar data by selecting the "Number Filters" where lots of options are available.
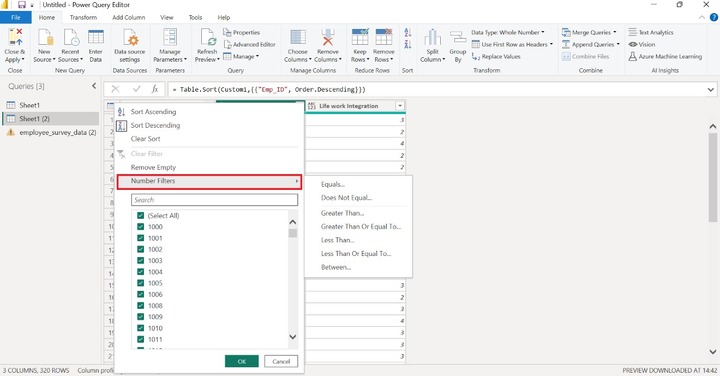
Example
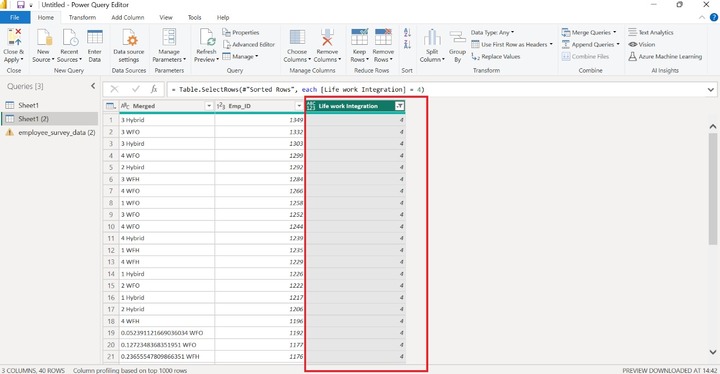
Select the "Life work Integration" column and expand the "Number Filters" and click on the "Equals". If you wish to retrieve only the data values which are equal to the "4". In the Filter Rows dialog box, select 4 from the list and click OK.
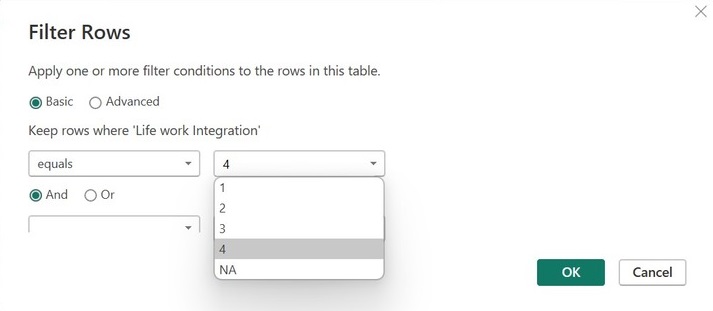
Therefore, the Number filter is being applied to the last column. As you can see in the screenshot, every data value whose value equals 4 has been extracted.