- Power BI - Home
- Power BI - Introduction
- Power BI - Installation Steps
- Power BI - Architecture
- Power BI Desktop
- Power BI - Desktop
- Power BI - Desktop Window
- Power BI Service
- Power BI - Window Supported Browsers
- Power BI - Generating Reports
- Power BI Desktop Service
- Power BI - Desktop vs Service
- Power BI - Supported Data Sources
- Power BI - Comparison Tools
- Power Query Editor
- Power Query Editor - Introduction
- Power Query Editor - Data Discrepancy
- Power Query Editor - Merge Queries (Part 1)
- Power Query Editor - Merge Queries (Part 2)
- Power BI - Develop Star Schema
- Data Modeling Concepts
- Power BI - Data Modeling
- Power BI - Manage Relationships
- Power BI - Cardinality
- Power BI - Dashboard Options
- Power BI Report Visualizations
- Power BI - Visualization Options
- Power BI - Visualization Charts
- Power BI - Stacked Bar Chart
- Power BI - Stacked Column Chart
- Power BI - Clustered Chart
- Power BI - 100% Stacked Chart
- Power BI - Area Chart and Stacked Area Chart
- Power BI - Line and Stacked Column Chart
- Power BI - Line and Clustered Column Chart
- Power BI - Ribbon Chart
- Power BI - Table and Matrix Visuals
- Power BI Map Visualizations
- Power BI - Creating Map Visualizations
- Power BI - ArcGIS Map
- Power BI Miscellaneous
- Power BI - Waterfall Charts
- Funnel Charts and Radial Gauge Chart
- Power BI - Scatter Chart
- Power BI - Pie Chart and Donut Chart
- Power BI - Card and Slicer Visualization
- Power BI - KPI Visual
- Power BI - Smart Narrative Visual
- Power BI - Decomposition Tree
- Power BI - Paginated Report
- Power BI - Python Script & R Script
- Power BI - Multi-row Card
- Power BI - Power Apps & Power Automate
- Power BI - Excel Integration
- Power BI Dashboard
- Power BI - Sharing Dashboards
- Power BI Sales Production Dashboard
- Power BI - HR Analytics Dashboard
- Power BI - Customer Analytics Dashborad
- Power BI - DAX Basics
- Power BI - Administration Role
- Power BI - DAX Functions
- Power BI - DAX Text Functions
- Power BI - DAX Date Functions
- Power BI - DAX Logical Functions
- Power BI - DAX Counting Functions
- Power BI - Depreciation Functions
- Power BI - DAX Information Functions
Power BI - Develop Star Schema
Star Schema where a Fact table is connected to so many dimensional tables and each dimension table has One-to-many relationships with the Fact table. The fact table usually contains integer values, whereas the dimension table contains descriptive information. The dimension tables denote the multiple entities related to business where filtration can also be permitted.
On the other hand, the fact table facilitates the summarization of the numeric field. It permits the data analysts to segment the complex data model that perpetually strengthens the relationship among the business entities.
Case Study
The task "generating the Star Schema in Data Modeling" is given by one of the Data Analytics mentors to Richard.
Solution
Richard would have a better understanding of the Fact table and dimension tables that play a crucial role in the Star Schema approach.
How to Develop a Star Schema?
The various steps need to be followed to develop the Star schema −
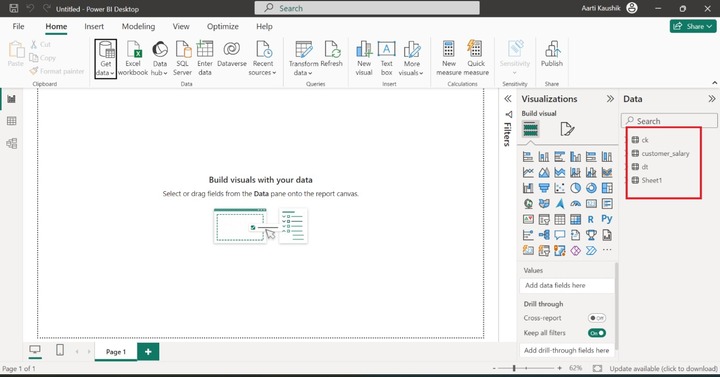
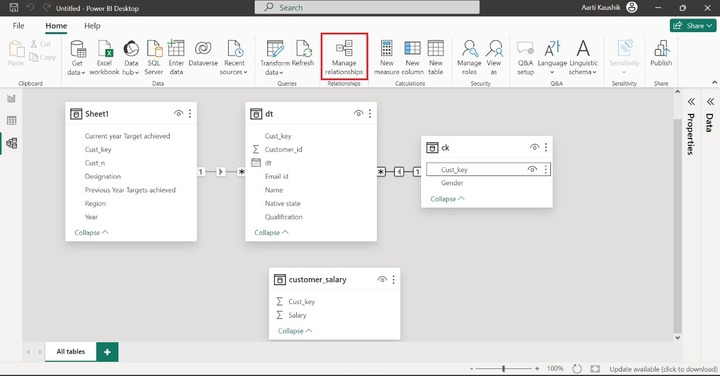
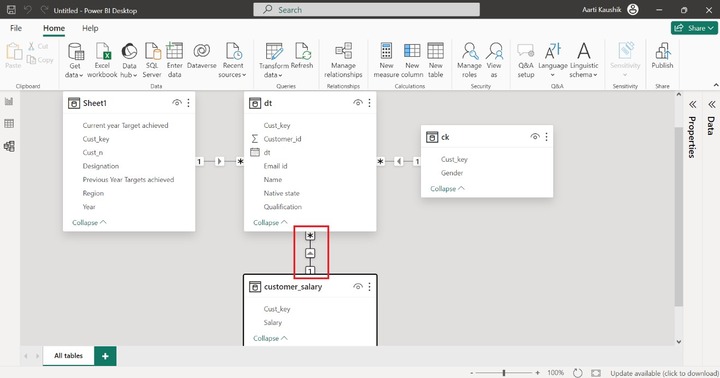
Step 1 − To accomplish this task, Richard needs to import the various tables "D:\custid.xlsx", "D:\ck.xlsx" and "D:\date.xlsx" in the BI desktop sequentially. Richard must select both sheets of the "ck" dataset. Here, in the snapshot, the Data pane comprises four tables "ck", "customer_salary", "dt", and "Sheet1".
Once all the tables are imported into this BI tool, it automatically detects relationships among tables.
Step 2 − Richard may switch to Model view to check the default relationship between loaded datasets that he can edit later on.
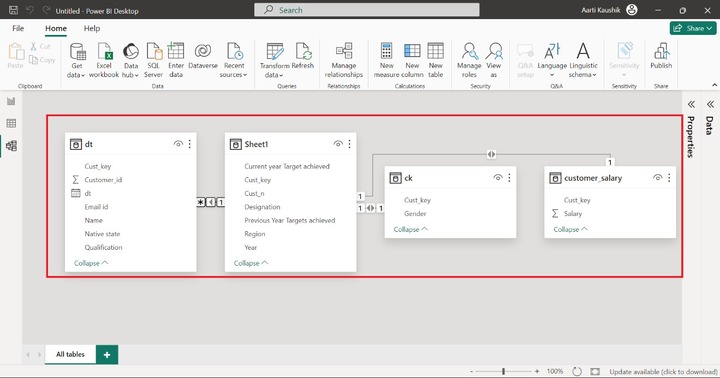
In this snapshot, there are one to many relationships between "Sheet1" and "dt", one to one relationship between "ck" and "Sheet1" and one to one relationship between "Sheet1" and "customer_salary". Now, Richard must edit this data model and transform it into Star schema.
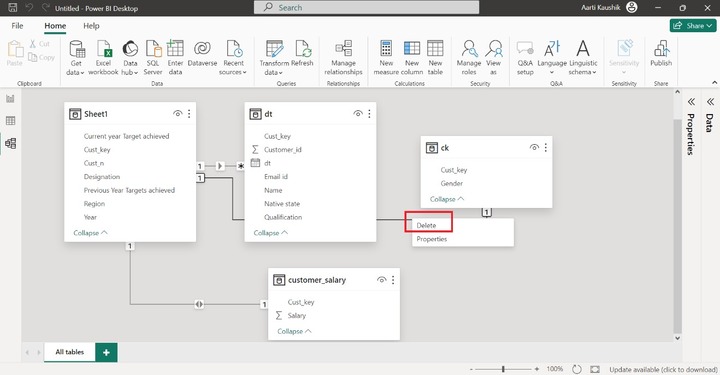
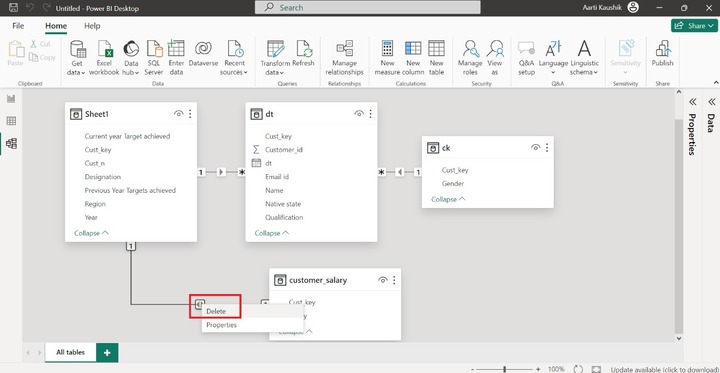
Step 3 − He interchanges the "dt" and "Sheet1" tables and right- click on the connection line between "ck" and "Sheet1" tables and selected the "Delete" option.
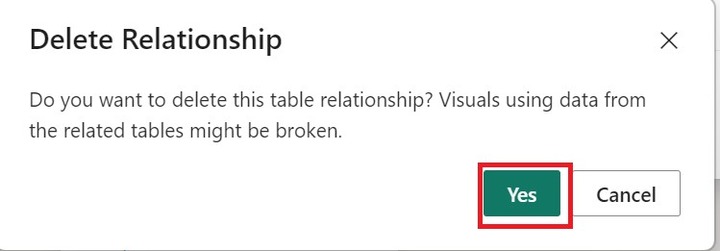
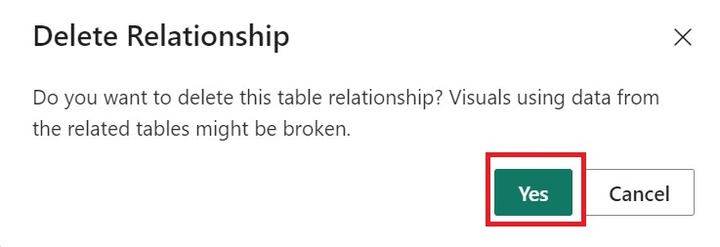
Another dialog box "Delete Relationship" will appear. He can click on the "Yes" to remove the relationship.
Now, he can drag the "Cust_key" column from the "ck" table and place it over the "Cust_key" column of the "dt" table to build the new relationship that is One to Many between the "ck" and "dt" tables.
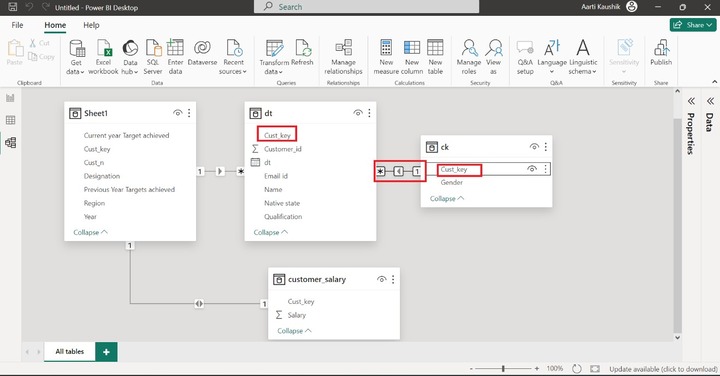
As he can see in the snapshot, the filtration direction between the "ck" and "dt" is unidirectional.
Step 4 − Similarly, he can right click on the filtration direction between "Sheet1" and "customer_salary" and choose "Delete".
The "Delete Relationship" dialog box will open where he can select "Yes" to delete the existing relationship.
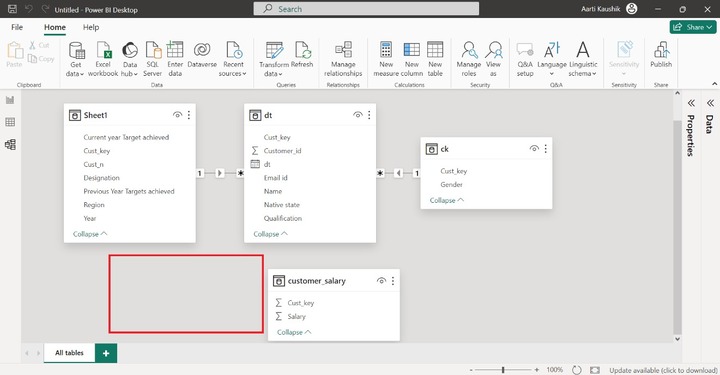
As he can view in the snapshot, the bidirectional link between the "Sheet1" and "customer_salary" has been removed.
Step 5 − He can click on the "Manage relationships" presented in the "Relationships" group under the "Home" to create the new relationships between "customer_salary" and "dt".
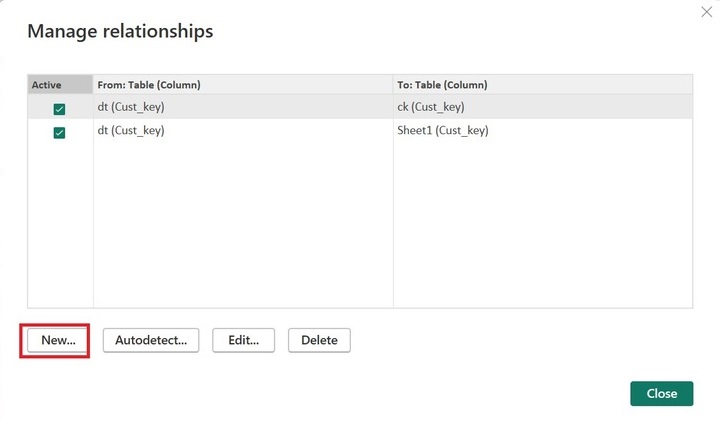
Step 6 − He can click on the "New" in the "Manage relationships" dialog box.
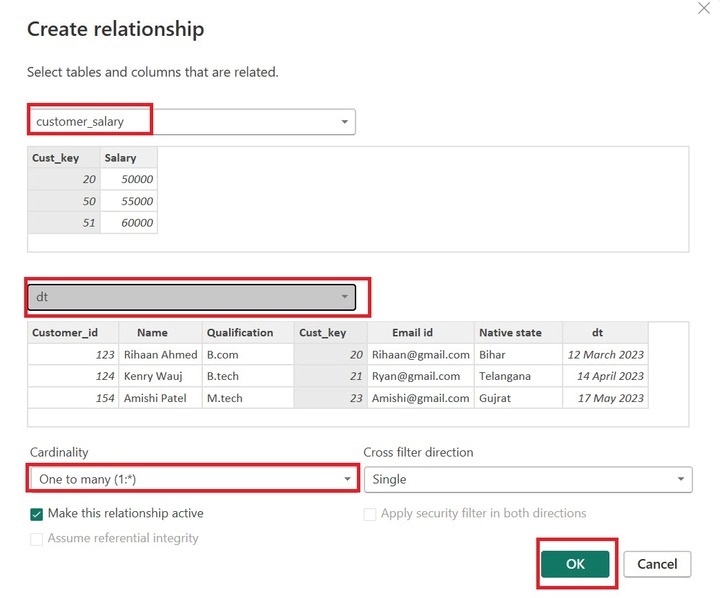
In the "Create relationship" dialog box, you may select "customer_salary" as the first table, choose "dt" as the second table, and click on the "One to many(1:*)" from the drop-down menu under the "Cardinality" section and finally, he may click on the "OK".
Step 7 − Moreover, the new relationship from the "customer_salary" table to the "dt(Cust_key)" table has been appended in the "Manage relationships" dialog box. He can click on "Close".
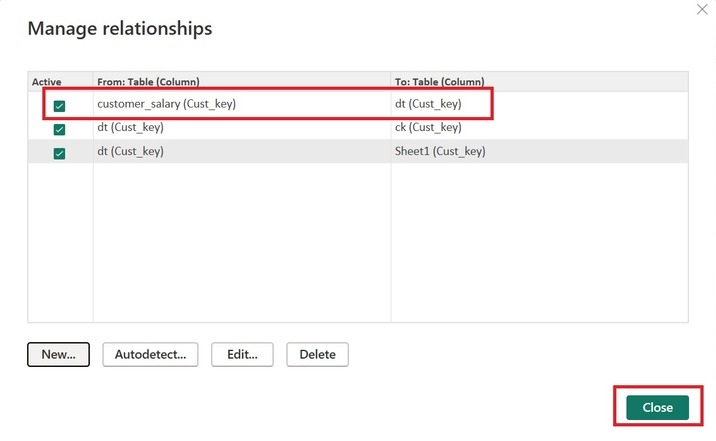
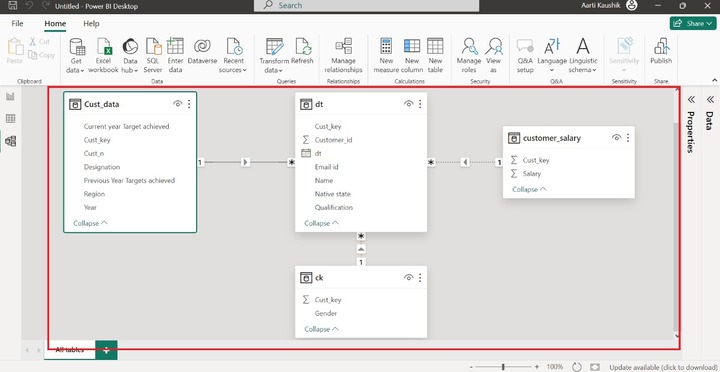
As you can notice in the screenshot, the one-to-many relationship is established between the "customer_salary" and the "dt" table.
Step 8 − Finally, the Richard student developed the Star schema by employing the four tables. In the given snapshot, the "dt" is the fact table and the other dimension tables make the "One to many" relationship with the fact "dt" table.
Key Points while Developing the Star Schema
- Before creating the Star schema, you need to specify the fact table and dimension tables.
- You may hide the unnecessary columns.
- Make sure that all the tables, except the fact table, contain unique values. If the dimension tables don't keep the unique values, then the One-to-Many relationship cannot be established.
- The fact table can have duplicate values.
- It is suggested to eliminate the unnecessary relationship between the dimension tables after loading the tables.
- One common column should exist in all the tables while creating the Star Schema model.
- You need to verify whether the foreign key resided in the Fact table or not which acts as a parent and must be pointed to the primary key of the referred dimension tables.
How to Identify a Fact Table vs a Dimension Table?
Yes, the table that has one cardinality is considered a Dimension table, and the table that has many cardinalities is termed a Fact table. Dimension table would have limited fields whereas a fact table can have multiple fields.