- Power BI - Home
- Power BI - Introduction
- Power BI - Installation Steps
- Power BI - Architecture
- Power BI Desktop
- Power BI - Desktop
- Power BI - Desktop Window
- Power BI Service
- Power BI - Window Supported Browsers
- Power BI - Generating Reports
- Power BI Desktop Service
- Power BI - Desktop vs Service
- Power BI - Supported Data Sources
- Power BI - Comparison Tools
- Power Query Editor
- Power Query Editor - Introduction
- Power Query Editor - Data Discrepancy
- Power Query Editor - Merge Queries (Part 1)
- Power Query Editor - Merge Queries (Part 2)
- Power BI - Develop Star Schema
- Data Modeling Concepts
- Power BI - Data Modeling
- Power BI - Manage Relationships
- Power BI - Cardinality
- Power BI - Dashboard Options
- Power BI Report Visualizations
- Power BI - Visualization Options
- Power BI - Visualization Charts
- Power BI - Stacked Bar Chart
- Power BI - Stacked Column Chart
- Power BI - Clustered Chart
- Power BI - 100% Stacked Chart
- Power BI - Area Chart and Stacked Area Chart
- Power BI - Line and Stacked Column Chart
- Power BI - Line and Clustered Column Chart
- Power BI - Ribbon Chart
- Power BI - Table and Matrix Visuals
- Power BI Map Visualizations
- Power BI - Creating Map Visualizations
- Power BI - ArcGIS Map
- Power BI Miscellaneous
- Power BI - Waterfall Charts
- Funnel Charts and Radial Gauge Chart
- Power BI - Scatter Chart
- Power BI - Pie Chart and Donut Chart
- Power BI - Card and Slicer Visualization
- Power BI - KPI Visual
- Power BI - Smart Narrative Visual
- Power BI - Decomposition Tree
- Power BI - Paginated Report
- Power BI - Python Script & R Script
- Power BI - Multi-row Card
- Power BI - Power Apps & Power Automate
- Power BI - Excel Integration
- Power BI Dashboard
- Power BI - Sharing Dashboards
- Power BI Sales Production Dashboard
- Power BI - HR Analytics Dashboard
- Power BI - Customer Analytics Dashborad
- Power BI - DAX Basics
- Power BI - Administration Role
- Power BI - DAX Functions
- Power BI - DAX Text Functions
- Power BI - DAX Date Functions
- Power BI - DAX Logical Functions
- Power BI - DAX Counting Functions
- Power BI - Depreciation Functions
- Power BI - DAX Information Functions
Power BI - Cardinality
As in the previous chapters, Richard has successfully learned about the loading, cleaning, and transformation of the dataset. Now, his task is to develop the connection between the two tables or more than two tables which is possible through the relationship cardinality.
The term relationship cardinality means to establish the relationship between two tables by linking a connection between them.
Types of Cardinalities in BI Desktop
Users may use three types of cardinalities in BI desktop.
- One-to-one relationship
- One to many relationships
- Many to many relationships
- Many-to-one relationship
Let's discuss each cardinality one by one −
One-to-one Relationship
Richard may develop the connection only with two tables by utilizing primary keys. The bidirectional relationship is to be deployed between two tables. In the initial table, each row refers to either zero or one in the other table.
One-to-many Relationship
Richard may develop the relationship between tables where every row in the first table is connected to the several rows in the other table. A one-to-many relationship is denoted by the notation (1-*). The flow direction is unidirectional.
Many-to-many Relationship
In the first table, each row is connected to multiple rows in another table and vice versa. It is denoted by (*:*). Richard may use more than two tables in this cardinality. The flow direction is bi-directional.
Many-to-one Relationship
In the first table, multiple rows correlate to a single row in another table. It is denoted by (*:1). Richard may use more than two tables in this cardinality. The flow direction is bi-directional.
One-to-one Relationship Between Two Tables
Step 1 − You may need to download the datasets named "D:\Dataset for power bi\sales da.xlsx" and "D:\Sales_date.xlsx". Make sure that there is a common column between these two tables that contains the unique values.
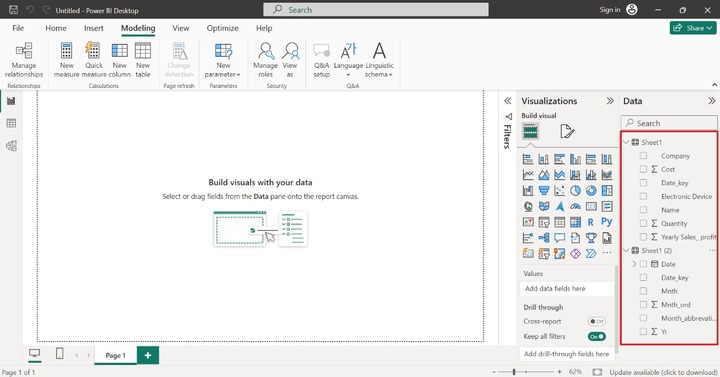
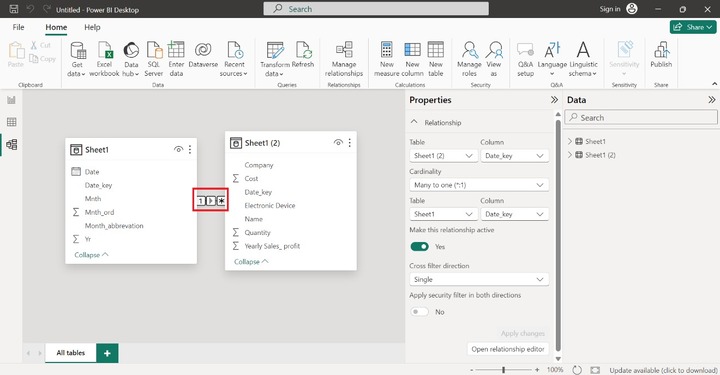
Step 2 − BI desktop automatically detects and creates the relationship for you after importing the datasets. You may switch to the Model View to observe the relationship between tables.
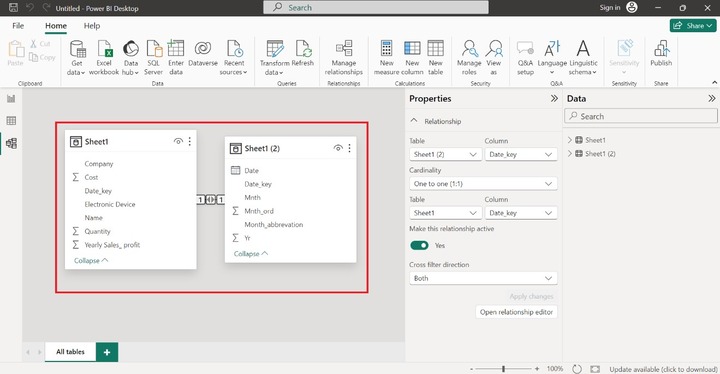
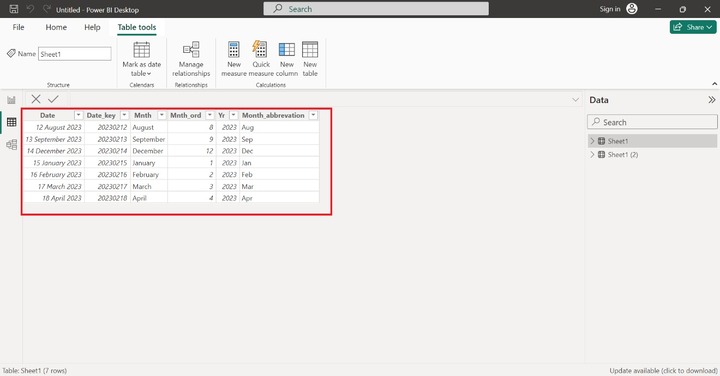
As you can notice in the screenshot, there is a one-to-one relationship between Sheet1 and Sheet1(2) tables as the common column Date_key existed between these two tables.
The Properties pane illustrates the complete information regarding the table name, common column description, and Cardinality information that is One to one(1:1).
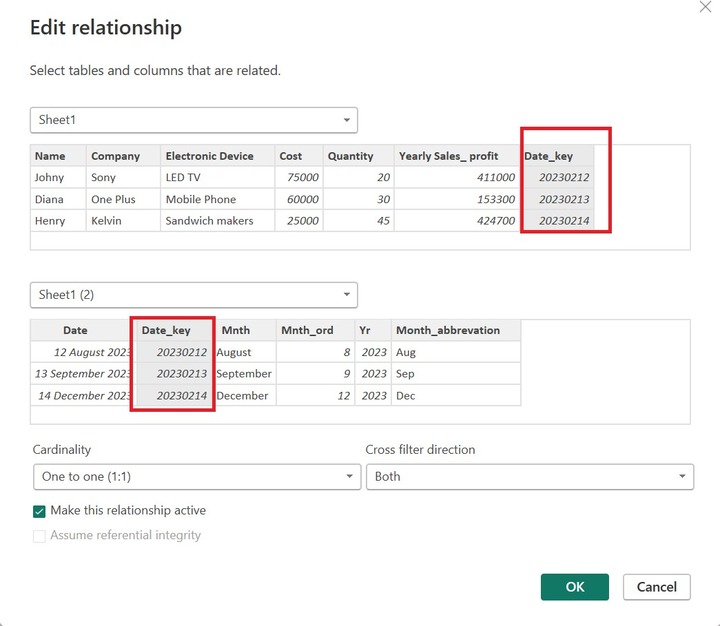
Step 3 − You may click on the "Open relationship editor" under the Properties.
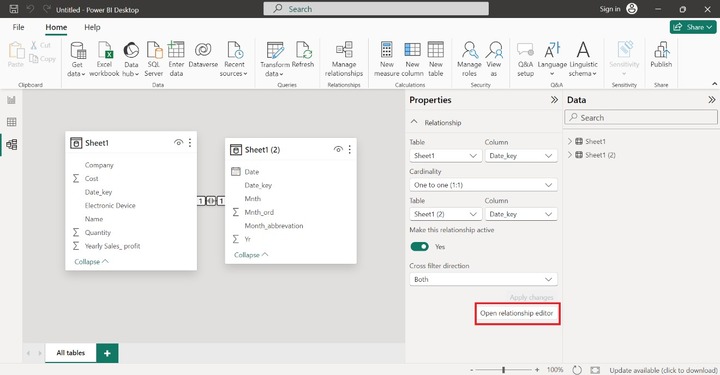
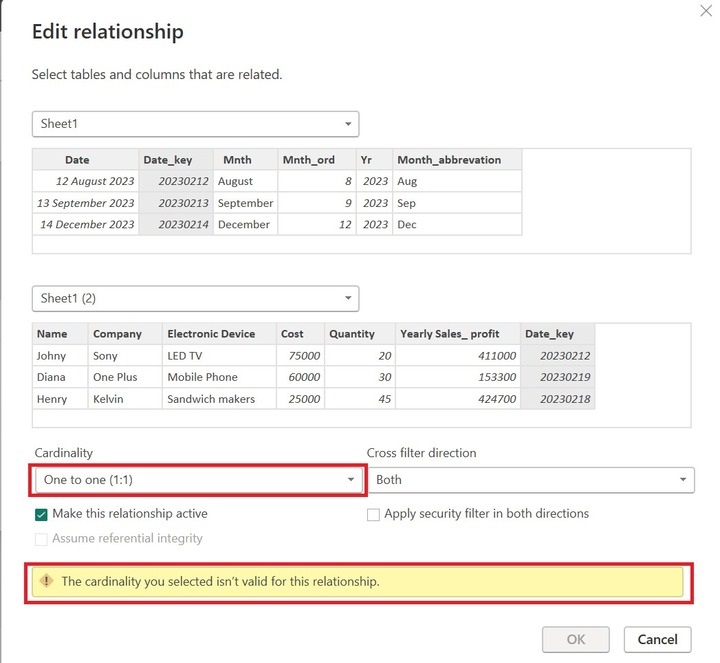
In the "Edit relationship", you can see the common column "Date_key" is highlighted.
How to Generate the Many to One Relationship?
Step 1 − You may need to download the two datasets on the BI desktop. The structure of the "Sheet1" and "Sheet1(2)" tables is shown below −
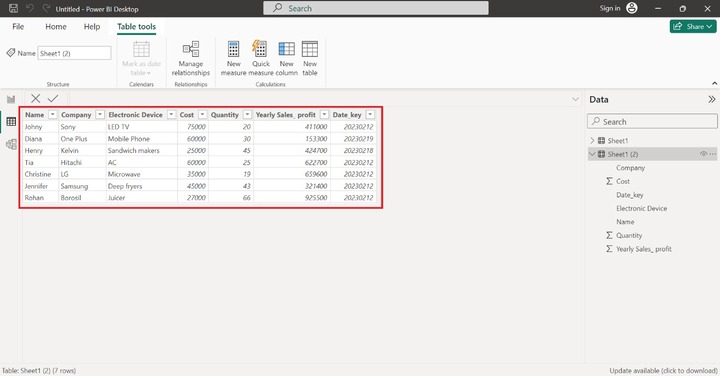
Step 2 − As you can see from the previous screenshots, the date_key columns in both tables contain the same field value "20230212". There are numerous field values of "20230212" in the Date_key column of Sheet1(2). To see how these two tables relate to one another, you can switch to the Model view. There is a correlation between one field value on Sheet 1 and several field values on Sheet 1 (2).
As you can notice in the snapshot, the Properties pan depicts the many-to-one relationship(*:1) between Sheet1(2) and Sheet1.
Step 3 − You may click on the "Open relationship editor" to modify the relationship. If you switch the cardinality like One to One (1:1), the warning message will receive as Sheet1(2)'s Date_key column contains the duplicate values.
In the similar way, you can generate the one-to-many relationship on two loaded tables.
Developing Many-to-Many Relationships with Three Tables
Step 1 − You need to import three tables "D:\Sales_date.xlsx", "D:\date.xlsx" and "D:\Dataset for power bi\sales da.xlsx" in the BI desktop.
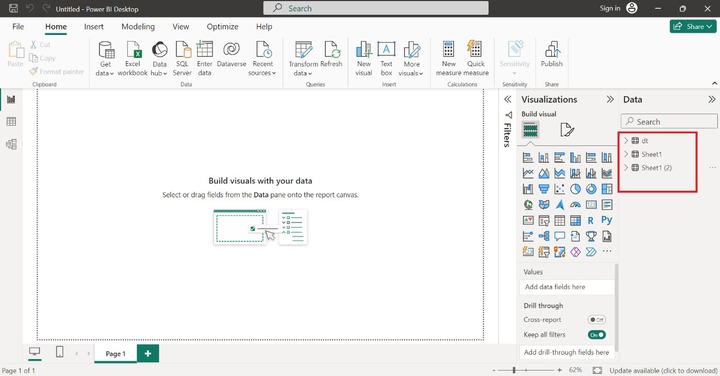
Step 2 − You can switch to the Model view to find the relationship among these tables.
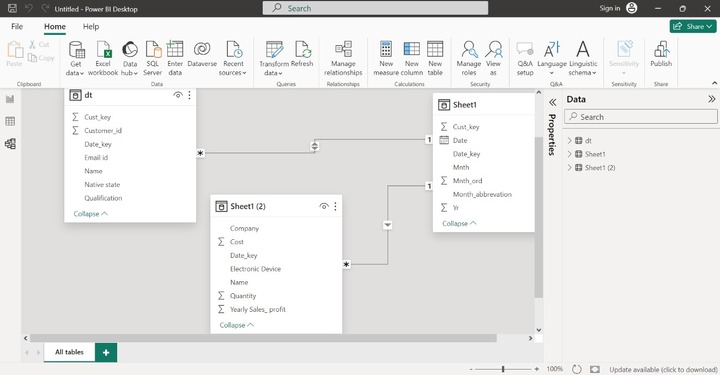
As you can predict from the snapshot, there is a many-to-one relationship between dt and Sheet1 table and also the Many-to-one relationship between Sheet1(2) and Sheet1 tables.
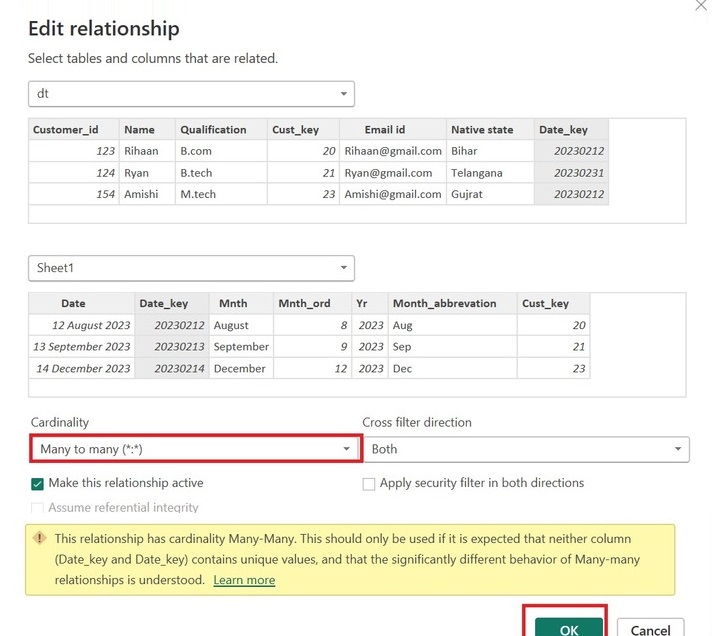
Step 3 − You can click on the "Open relationship editor" to modify the auto-detect relationships. Select the "Many to Many(*:*) from the list under the "Cardinality" section and then click on "OK". The warning message indicates that many to many relationships exist between a few tables.
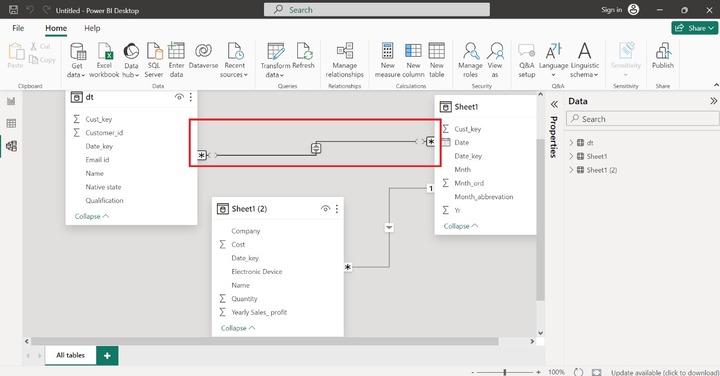
Here, you can observe in the below snapshot, there is a many to many relationships between the "dt" and "Sheet1" tables. The flow of direction is birdirectional.
Best Practices While Developing Data Modelling
- Users need to avoid Many-to-many relationships as it creates confusion and ambiguity in the complicated models.
- After loading the data, transform the dataset first to eliminate errors like incorrect values, null values, etc.
- It would be suggested to remove the inactive relationship in the data model.