- Power BI - Home
- Power BI - Introduction
- Power BI - Installation Steps
- Power BI - Architecture
- Power BI Desktop
- Power BI - Desktop
- Power BI - Desktop Window
- Power BI Service
- Power BI - Window Supported Browsers
- Power BI - Generating Reports
- Power BI Desktop Service
- Power BI - Desktop vs Service
- Power BI - Supported Data Sources
- Power BI - Comparison Tools
- Power Query Editor
- Power Query Editor - Introduction
- Power Query Editor - Data Discrepancy
- Power Query Editor - Merge Queries (Part 1)
- Power Query Editor - Merge Queries (Part 2)
- Power BI - Develop Star Schema
- Data Modeling Concepts
- Power BI - Data Modeling
- Power BI - Manage Relationships
- Power BI - Cardinality
- Power BI - Dashboard Options
- Power BI Report Visualizations
- Power BI - Visualization Options
- Power BI - Visualization Charts
- Power BI - Stacked Bar Chart
- Power BI - Stacked Column Chart
- Power BI - Clustered Chart
- Power BI - 100% Stacked Chart
- Power BI - Area Chart and Stacked Area Chart
- Power BI - Line and Stacked Column Chart
- Power BI - Line and Clustered Column Chart
- Power BI - Ribbon Chart
- Power BI - Table and Matrix Visuals
- Power BI Map Visualizations
- Power BI - Creating Map Visualizations
- Power BI - ArcGIS Map
- Power BI Miscellaneous
- Power BI - Waterfall Charts
- Funnel Charts and Radial Gauge Chart
- Power BI - Scatter Chart
- Power BI - Pie Chart and Donut Chart
- Power BI - Card and Slicer Visualization
- Power BI - KPI Visual
- Power BI - Smart Narrative Visual
- Power BI - Decomposition Tree
- Power BI - Paginated Report
- Power BI - Python Script & R Script
- Power BI - Multi-row Card
- Power BI - Power Apps & Power Automate
- Power BI - Excel Integration
- Power BI Dashboard
- Power BI - Sharing Dashboards
- Power BI Sales Production Dashboard
- Power BI - HR Analytics Dashboard
- Power BI - Customer Analytics Dashborad
- Power BI - DAX Basics
- Power BI - Administration Role
- Power BI - DAX Functions
- Power BI - DAX Text Functions
- Power BI - DAX Date Functions
- Power BI - DAX Logical Functions
- Power BI - DAX Counting Functions
- Power BI - Depreciation Functions
- Power BI - DAX Information Functions
Power BI - Excel Integration
In this chapter, you will learn how to integrate Excel with Power BI.
Using Excel Data
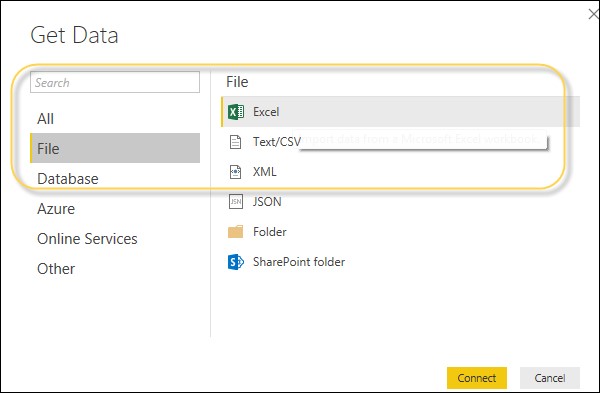
Using Power BI, you can also import Excel workbook files from the local drive into Power BI. To import data from the Excel sheet, you have to ensure that each column has a proper name. To import an Excel file in Power BI, navigate to Get Data → Files → Local Files.
Importing xls Files
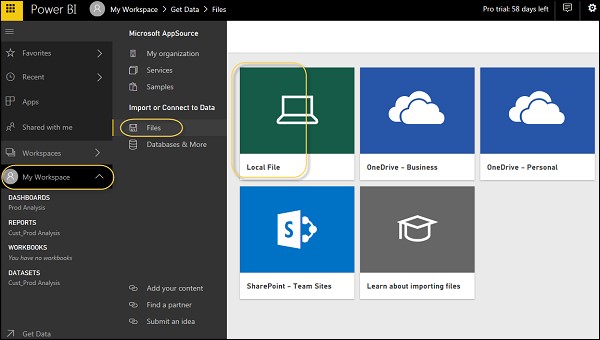
In Power BI Service, navigate to My Workspace → File → Local File.
Also, note that your Excel file doesn't need to only be saved on the Local Drive. You can also import an Excel workbook from OneDrive or even from SharePoint.
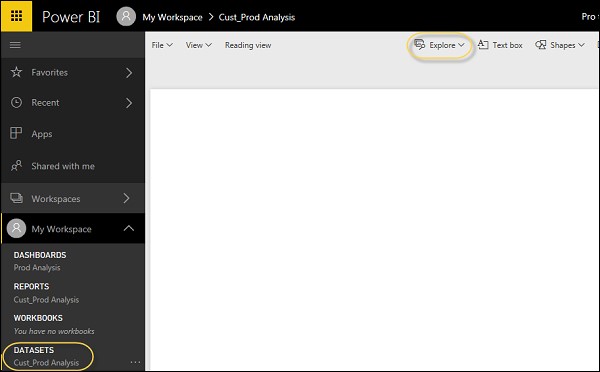
Once the dataset is imported, you are ready to create the reports in Power BI. The Imported dataset is available under the "DATASETS" option in the Power BI menu.
Double-click Datasets. Then, navigate to the Explore tab. This will open a new Report Canvas. All the fields from your table and corresponding columns are available under the Fields option on the right side of the screen.
To create a report, select any visualization and add the fields from the table to the visualization.
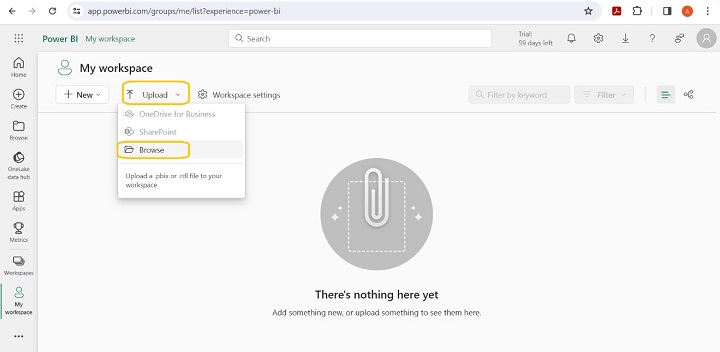
For example − Select "My workspace" and then click on the "Upload" tile and choose "Browse".
Note that you can upload only .pbix or .rdl files to the workspace. Other extensions are not supported. Make sure that files should be saved in One Drive. Files from other locations in the local system cannot be uploaded to the Power BI service.
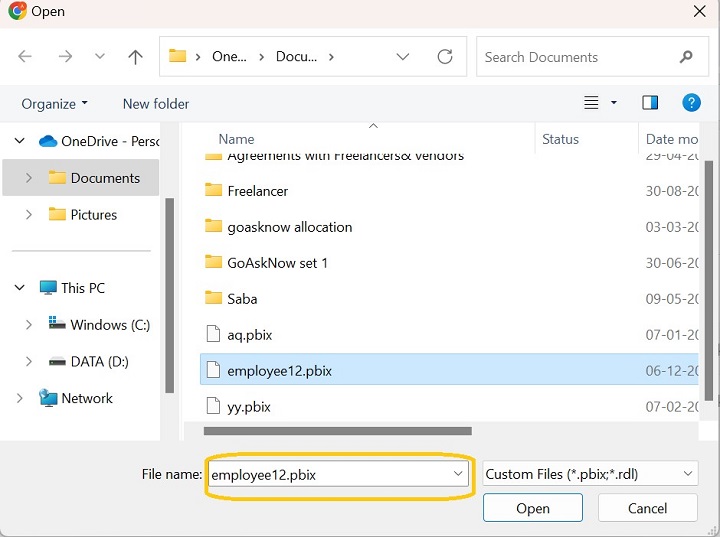
Select the specified file from the local system and click Open.
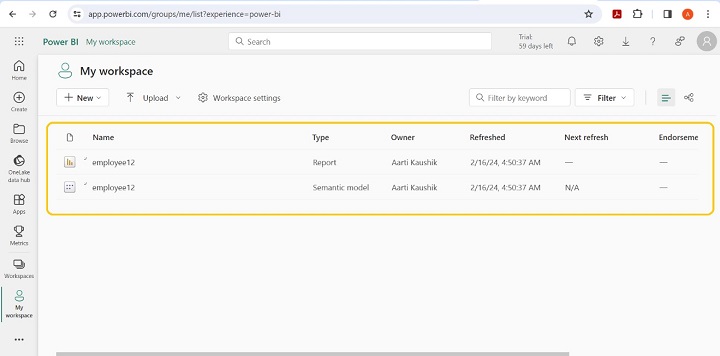
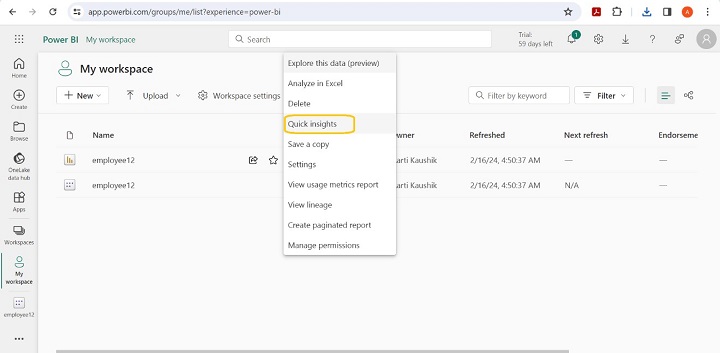
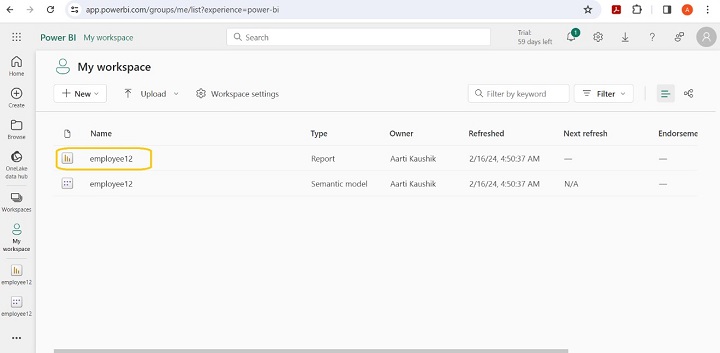
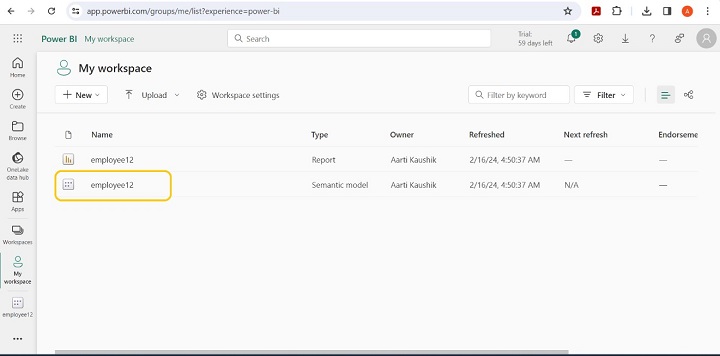
Whenever you upload the file, two types of the same file are generated in My workspace. The first file shows the Report type and the other type of Employee12 indicates the Semantic Model. Therefore, the specified file is uploaded to My Workspace.
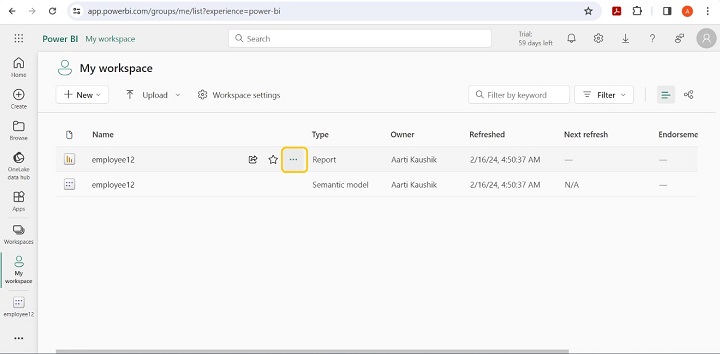
Click on the three dots and select the Quick insights from the list.
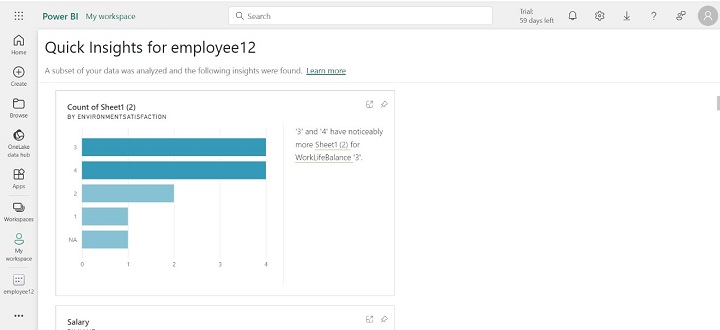
Quick insights of the emplyee12 files is displayed.
Click on the "employee12" file and select "Analyze in Excel" from the "Export" tile.
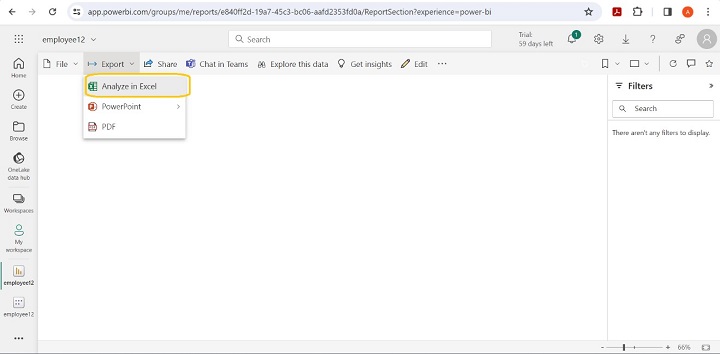
Therefore, the Excel file is downloaded to your local system.

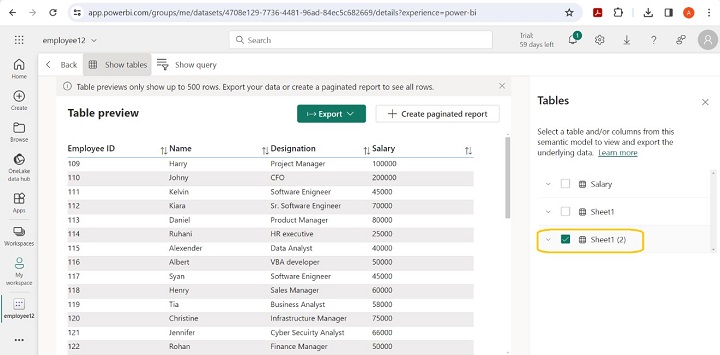
Another way to analyze the file in Excel is to click on the "employee12" Semantic model from the My Workspace.
Select Sheet1(2) and the table preview is displayed on the screen. You can export this table into Excel, PDF, CSV, XML, etc.
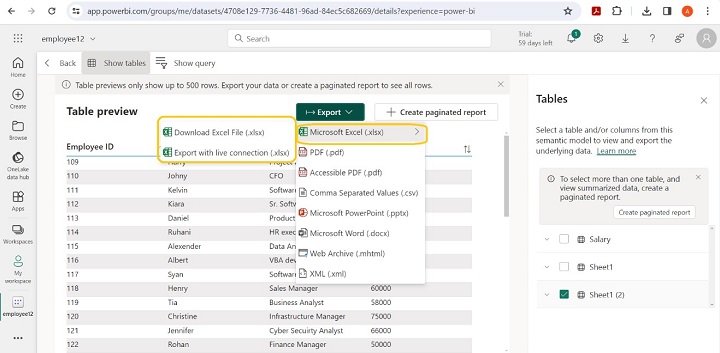
If you export this table into Excel, two options are available: "Download Excel file" and "Export with live connection". Click on "Download Excel File" to analyze the data.
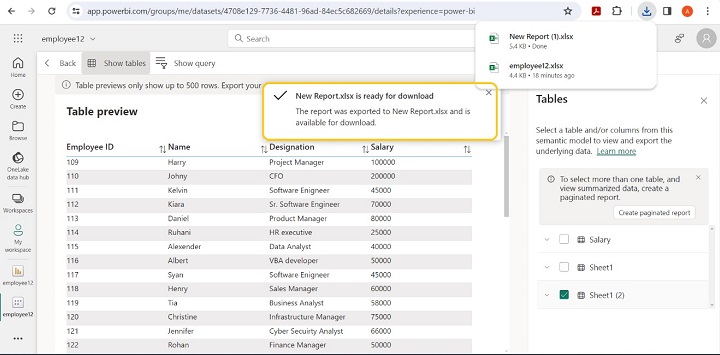
The message " New Report.xlsx is ready for download" is prompted on the screen.
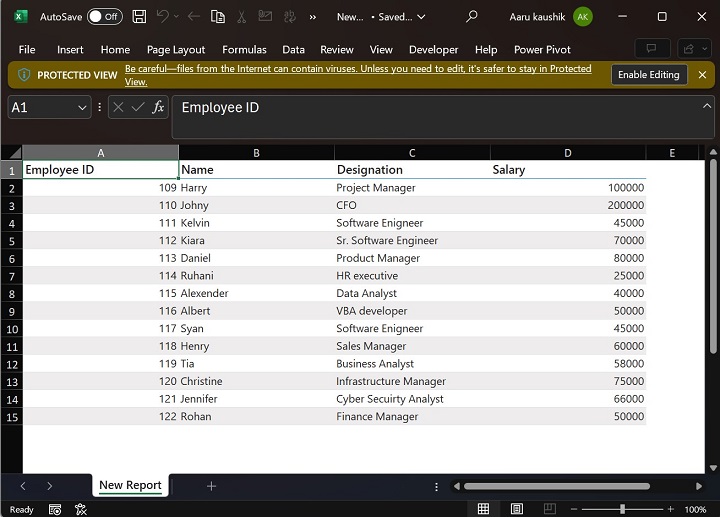
As you can observe the downloaded report is opened in Excel.