- Power BI - Home
- Power BI - Introduction
- Power BI - Installation Steps
- Power BI - Architecture
- Power BI Desktop
- Power BI - Desktop
- Power BI - Desktop Window
- Power BI Service
- Power BI - Window Supported Browsers
- Power BI - Generating Reports
- Power BI Desktop Service
- Power BI - Desktop vs Service
- Power BI - Supported Data Sources
- Power BI - Comparison Tools
- Power Query Editor
- Power Query Editor - Introduction
- Power Query Editor - Data Discrepancy
- Power Query Editor - Merge Queries (Part 1)
- Power Query Editor - Merge Queries (Part 2)
- Power BI - Develop Star Schema
- Data Modeling Concepts
- Power BI - Data Modeling
- Power BI - Manage Relationships
- Power BI - Cardinality
- Power BI - Dashboard Options
- Power BI Report Visualizations
- Power BI - Visualization Options
- Power BI - Visualization Charts
- Power BI - Stacked Bar Chart
- Power BI - Stacked Column Chart
- Power BI - Clustered Chart
- Power BI - 100% Stacked Chart
- Power BI - Area Chart and Stacked Area Chart
- Power BI - Line and Stacked Column Chart
- Power BI - Line and Clustered Column Chart
- Power BI - Ribbon Chart
- Power BI - Table and Matrix Visuals
- Power BI Map Visualizations
- Power BI - Creating Map Visualizations
- Power BI - ArcGIS Map
- Power BI Miscellaneous
- Power BI - Waterfall Charts
- Funnel Charts and Radial Gauge Chart
- Power BI - Scatter Chart
- Power BI - Pie Chart and Donut Chart
- Power BI - Card and Slicer Visualization
- Power BI - KPI Visual
- Power BI - Smart Narrative Visual
- Power BI - Decomposition Tree
- Power BI - Paginated Report
- Power BI - Python Script & R Script
- Power BI - Multi-row Card
- Power BI - Power Apps & Power Automate
- Power BI - Excel Integration
- Power BI Dashboard
- Power BI - Sharing Dashboards
- Power BI Sales Production Dashboard
- Power BI - HR Analytics Dashboard
- Power BI - Customer Analytics Dashborad
- Power BI - DAX Basics
- Power BI - Administration Role
- Power BI - DAX Functions
- Power BI - DAX Text Functions
- Power BI - DAX Date Functions
- Power BI - DAX Logical Functions
- Power BI - DAX Counting Functions
- Power BI - Depreciation Functions
- Power BI - DAX Information Functions
Power BI - Depreciation Functions
What are DAXs Depreciation Functions?
The depreciation value of the asset over certain periods is retrieved from DAX's depreciation functions.
Case Study − Richard must define each DAX Depreciation function in this case study by either picking a new measure option or a new column where the DAX information system expression is required. The DAX information system function evaluated the DAX expression depending upon the mentioned arguments inside the depreciation function.
Dataset − You may import the "D:\customer data.xlsx" in the BI desktop.
The list of the Depreciation functions along with examples is given below −
AMORDEGRC Function
It retrieves the defined period's depreciation.
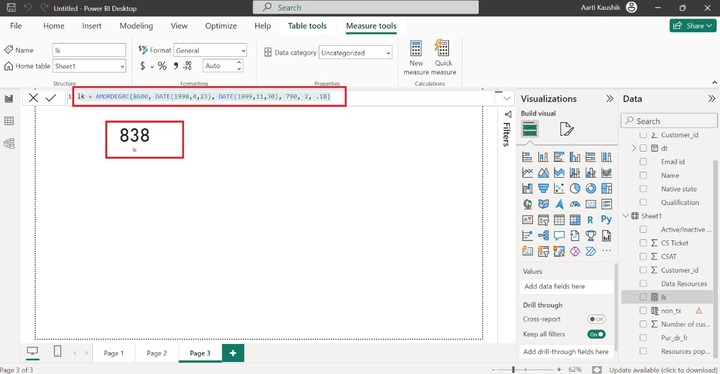
Example − You may enter the expression −
lk = AMORDEGRC(8600, DATE(1998,4,23), DATE(1999,11,30), 790, 4, .13)
Here, "8600" denotes the cost, the brought date is defined in the second parameter, the third parameter indicates the end date, the fourth parameter denotes the salvage value, the fifth parameter indicates the period and the sixth parameter specifies the depreciation rate.
AMORLINC Function
It retrieves the depreciation for every accounting period.
Example − You may write the DAX expression −
tr = AMORLINC(8900, DATE(1999,4,23), DATE(2000,11,30), 567, 3, 0.11)
Here, AMORLINC takes six parameters: the first parameter is the assets cost, the second parameter is the assets purchasing date, the third parameter is the completion date, the fourth parameter denotes the salvage value, the specific period is denoted by the fifth parameter and sixth parameter specifies the depreciation rate.
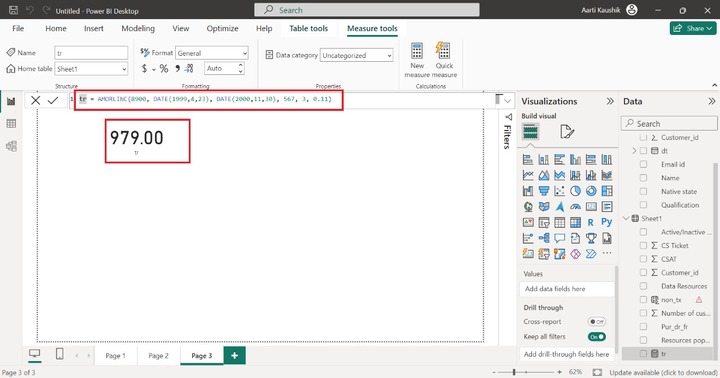
As you may notice in the screenshot, the resulting value which is 979 shows the depreciation of the third period.
DB Function
It retrieves the depreciation over certain periods.
Example − You can enter the DAX expression −
rt = DB(76000.00, 2300.00, 3,1)
Here, rt specifies the name of the new measure and the DB functions comprise four parameters: the asset's beginning cost is specified by the first parameter; the second parameter shows the value after the depreciation; the asset's life is illustrated by the third parameter; and the fourth is the number of years for which the depreciation is being calculated.
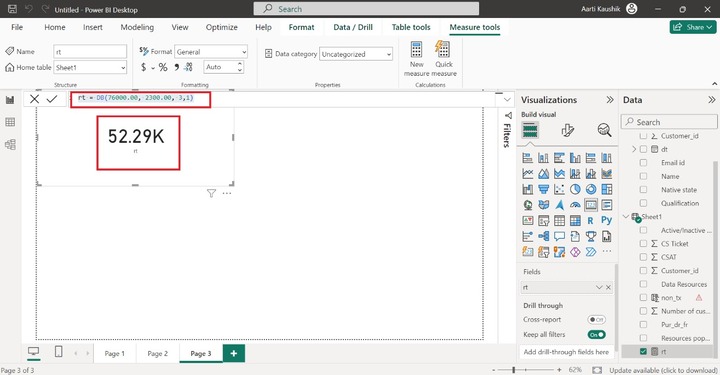
Hence, you can notice in the screenshot, the computed value is 52.29K.
DDB Function
It usually employs the double declining balance method to compute the depreciation over a certain time.
Example − You may enter the expression in the formula bar −
dpr = DDB(87000.00, 4600.00, 5,2)
The given DDB function contains four parameters: the first is the "87000" representing the initial cost; the second indicates the salvage value; the third is the asset's life; and the fourth is the specific year for which the depreciation is being calculated.
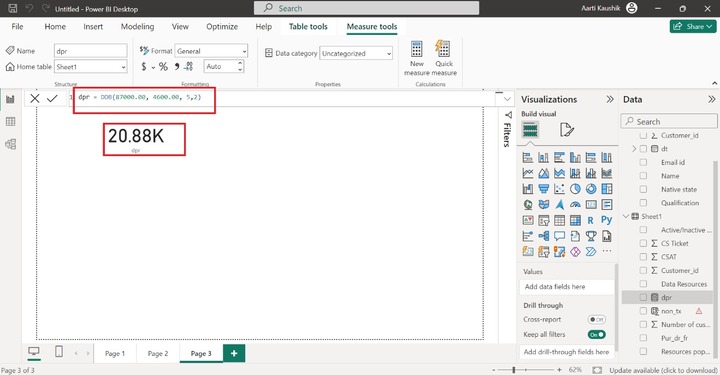
As you can observe in the screenshot, the resulting value is 20.88K.
SLN Function
It retrieves the asset's straight-line depreciation for the specified period.
Example − You may write the DAX expression for the new measure "tr" −
tr = SLN(9800.00, 4900.00, 4)
Here, the first argument illustrates the initial cost, the second argument indicates the salvage value and the third argument specifies the assets life.
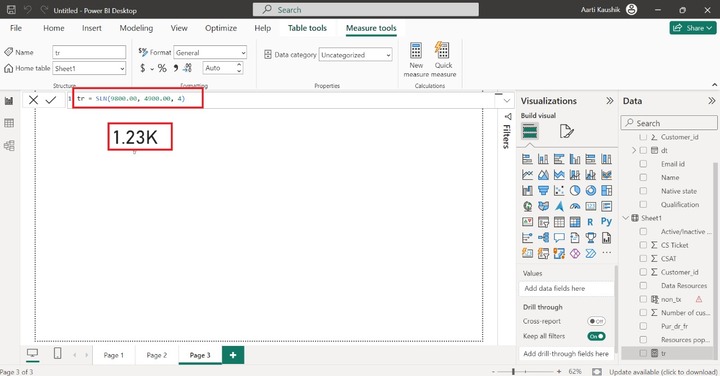
Hence, the resulting value of the new measure sl is 1667.
SYD Function
It retrieves an asset's total annual digit depreciation over a given period.
Example − You can enter the formula −
sd = SYD(65000.00, 6000.00, 5, 2)
Here, the first parameter denotes the starting cost, and the second parameter indicates the salvage value. The asset gets depreciated for five years, as specified by the third parameter and the fourth parameter indicates the certain period that is 2.
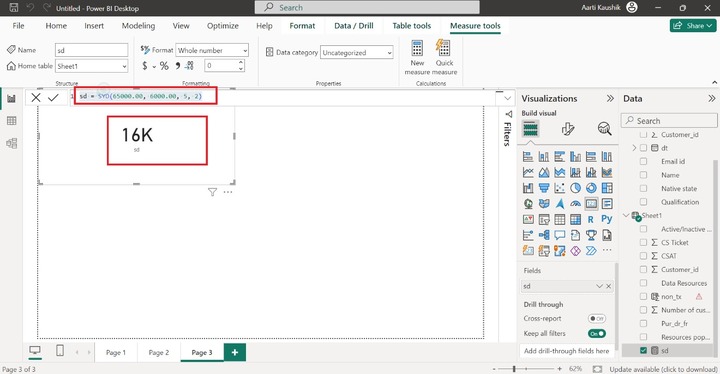
As you can observe in the screenshot, the computed result is 16k.
Depreciation Functions
The following table provides a brief description of Depreciation Functions −
| Functions | Explanations |
|---|---|
| AMORDEGRC | It obtains the depreciation over the supported time frame. |
| AMORLINC | France's accounting system employed this function to evaluate the depreciation for an accounting time frame. |
| DB | It returns the depreciation over specified periods. |
| DDB | It is similar to the DB function except a few methods like the double declining balance method are utilized to retrieve the depreciation. |
| SLN | For the given periods, it returns the assets linear depreciation. |
| SYD | It obtains the total yearly digit depreciation of an asset over a specified time frame. |